Dr. Guillaume Zagury, based in Shanghai, a specialist in international public health and health innovations, comments for the Community on a day-to-day basis on the evolution of the epidemic for more than three months, and provides a first-of-the-art understanding on its “country and region analysis” and predictable consequences (experiments of SARS in 2003 and Covid-19 in China).
A remarkable multidisciplinary volunteer team allows the realization of this analysis which is intended to be factual and objective (by the way, do not hesitate to join us: mail below):”every success is collective”.”.
Beyond the volunteer skills, this project was made possible by the support of our citizens’ vision patrons: the Paul Bennetot Foundation (Matmut Foundation under the aegis of the Foundation of the Future), B Square, Tag Advisory, Daxue Consulting, as well as various fellow travelers (Jérôme, Dr. Benoît Rossignol,Gilles Langourieux,…)
All our illustrations created for more than 100 days, will soon be available to you on our website and you can download a large part of them. (www.covidminute.com).
I. COVID 360 “MINUTE”: graphs and maps (80% of the information)
I.1 France D.Day – 17 days (cf incubation of the disease – 20 days):
Indicators always green

Containment: one of the major measures
Different other hypotheses envisaged: Immunity crosses (/ other coronavirus for example),Temperature and humidity (winter in Latin America), Natural Cycle, …
I.2 Vision time: we follow Italy with 10 days lag
Comparative chronological evolution of resuscitation cases France/Italy


I.3 Europe: no second wave in countries with talks before us

Note that some countries (Greece, Finland, Ireland,..) declare certain results only on a weekly basis.
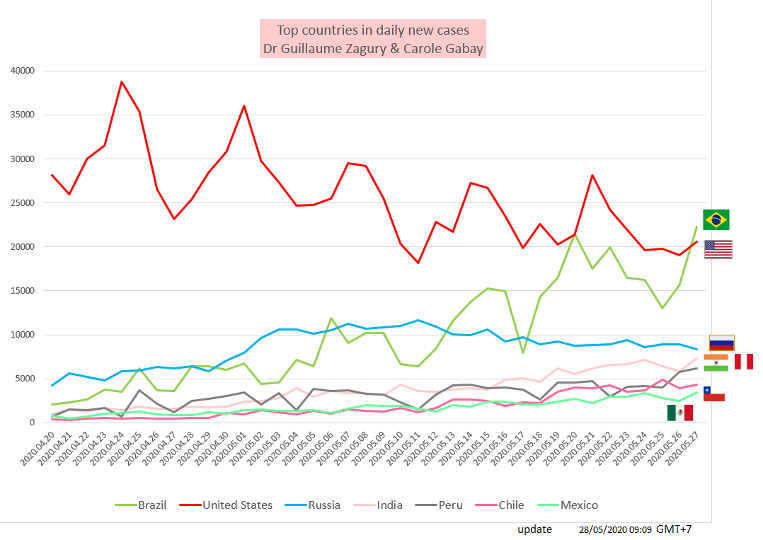
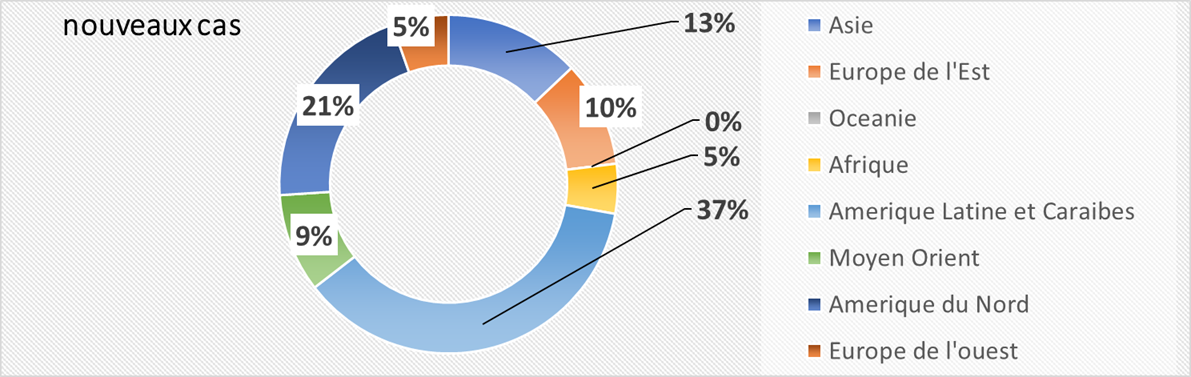
I.4 World
Equation to the dimensions: 3 million cases currently reported, 100 k new cases day, and 100K dead in the USA.
- Top 10 countries: Brazil in head (epidemic phase) ahead of the USA (trend decline): cf iconography title.
- Note that epidemic is currently growing rapidly croissance in Latin America (37% of new cases cas versus 20% in the US)
I.5 The result indicator
Attention to the interpretation of this type of graph by non-specialists, as we mentioned more than 6 weeks ago,: computer correlation is not synonymous with causality!
II. 360-degree analysis:
Compare what is comparable: “reanimation” cinetics in Italy and China (Hubei)
With the contribution of Dr. Bachir Athmani, Stéphane and Carole Gabay, companions of the first hour, whom I thank again for the unwavering support of yours.
II.1 Grosso modo
Hubei – Italy in terms of population (up to 60M) and area.
II.2 Wuhan
The provincial capital, Wuhan, the origin of the epidemie, is the very type of Chinese megapolis with:
A recent demographic acceleration (1M in 1950 and 10M in 2020) following the urbanization of the country
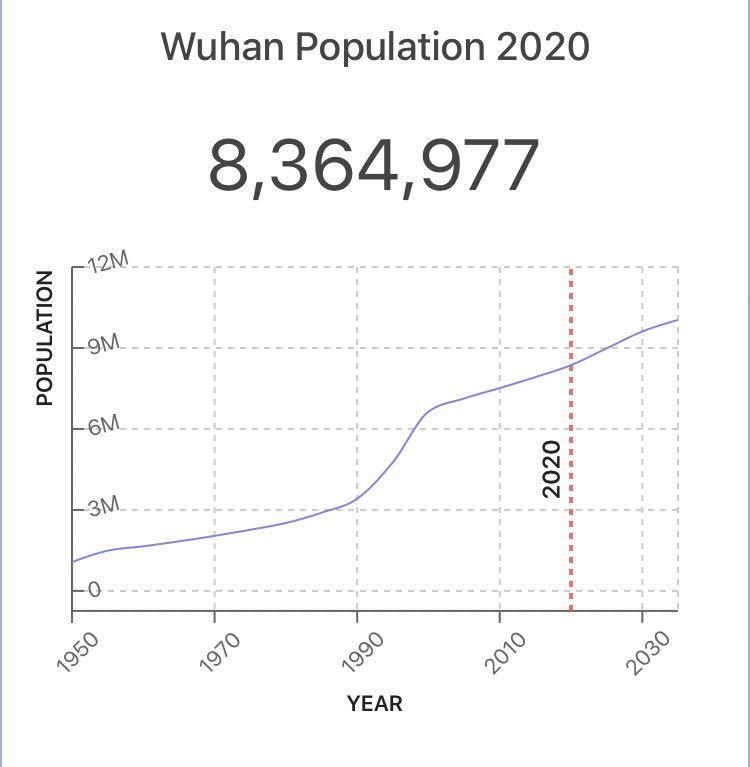
A global city (international airport with more than 50 daily international flights at the beginning of the year)
I.3 The cases of reanimation declared
We have studied the allure of historical curves in these two very similar entities, on relatively measurable elements: the cases of reanimation declared
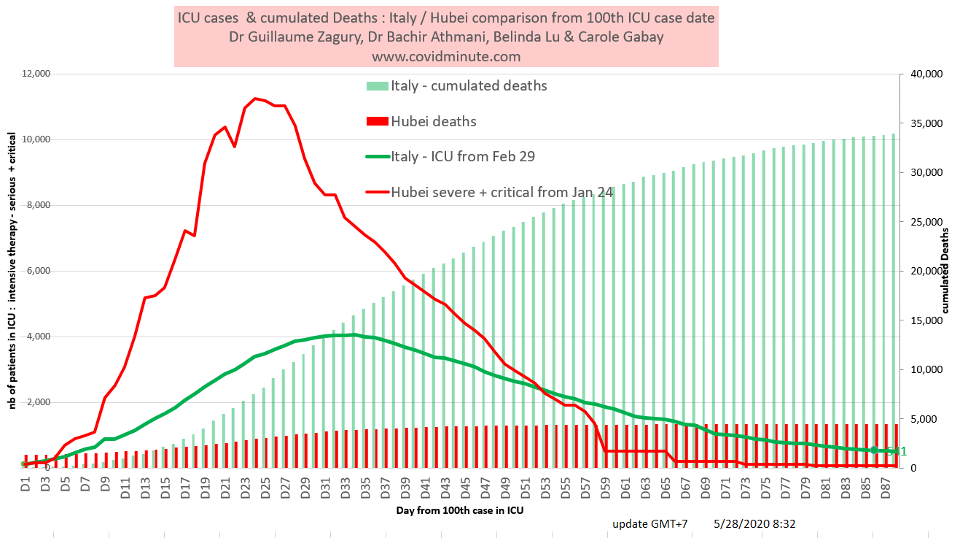
I.4 Phase of sideration
Certainly after an initial phase of sideration observed both in Hubei and lombardy with cases under reporting, the extremely strict measures (very severe confinement for 76 days in Hubei and severes in Lombardy / more than 60 days) have paid off: after about 12 weeks (60 days in Hubei and 86 in Italy), the epidemic seems to be in the 2 environment.
I.5 the correlation “computer”
(3 times more cases in Hubei / Italy and 3 times less dead) must be very careful: computer is not synonymous with causality!
- More cases in Hubei, because the disease was not known initially (cf contagiosities of asymptomatic cases, tests, dispatching patients in different hospitals of the city,…), and population densities are very different (1200/km2 in Wuhan).
- As far as the deads are concerned (75% of the deads are distributed over the over 75s), let us be measures, because the Chinese population in general, and in Hubei in particular, is younger than in Italy (see one of the “oldest” countries in the world). We will not enter into the debate, and leave the conclusions latereries to the demographers (cf pairing and comparison of the pyramids of the ages ….)
I.6 Next analysis: Brazil (Saturday or Monday)
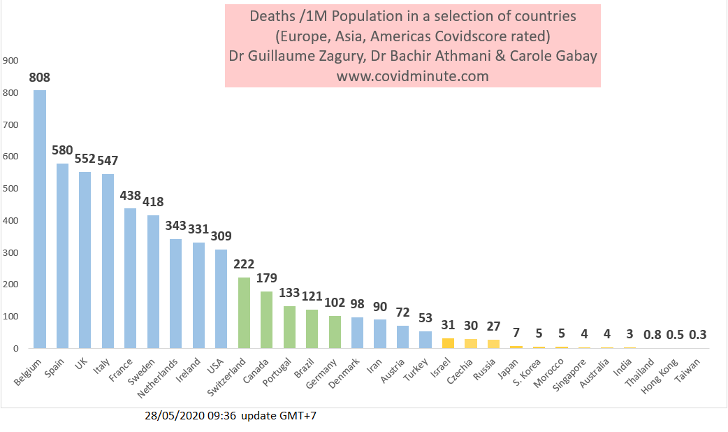
III WORLD
Beware of certain figures (number of cases, deaths…) that are highly questionable because they vary from country to country (e.g. availability of tests), with measurement biases and therefore major under-reporting in some countries.
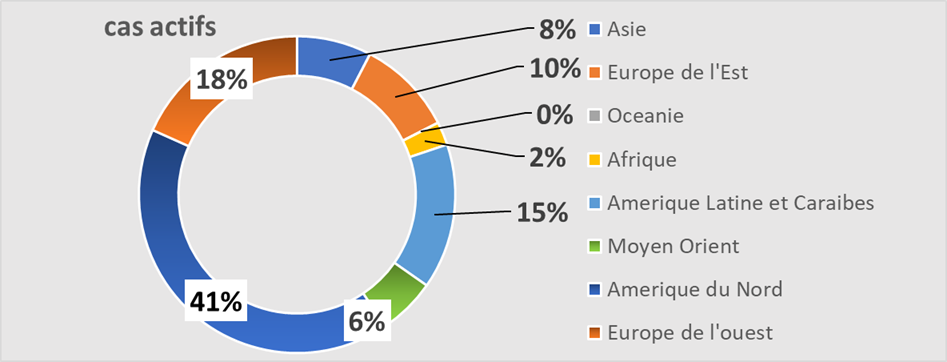
Prevalence: 2,932,000 active cases confirmed for observation
Vision time:

Continent: 55% of cases in America 20% still in Europe, 10% in Russia…
By country :

Top 10 countries
United States 1.16 M (yesterday 1.15 M)
Russia 225k (yesterday 227k)
Brazil 220k (yesterday 208k)
United Kingdom 200k(maintained at their last known prevalence level)
France 88k (yesterday 88k)
India 86k (yesterday 82k)
Peru 76k (yesterday 73k)
Spain 60k (yesterday 59k)
Italy 51k (yesterday 53k)
Chile 48k (yesterday 46k)
Pakistan 39k (yesterday 38k)
2. INCIDENCE: : 103,000 new cases detected yesterday

Long time ( January 1st)
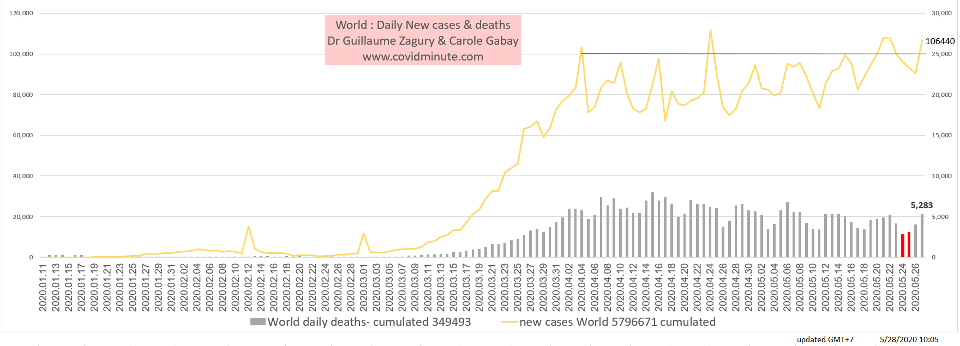
Geographic:
By continent: Latin America for more than 1/3 of cases (and likely under declaration)
By country: cf minute analysis
USA 18k (18k yesterday)
Brazil 15k (11k yesterday)
Russia 9k (9k yesterday)
India 6k (6k yesterday)
Peru 6k (4k yesterday)
England 4k (2k yesterday)
Chile 4k (4kyesterday)
Mexico 2k (3k yesterday)
Pakistan, Bangladesh, Afghanistan, Saudi Arabia, Iran, Qatar, Kuwait, United Arab Emirates, Belarus, Turkey, Spain, Sweden, South Africa, Cameroon, Canada, Egypt, Colombia: 1 to 2k
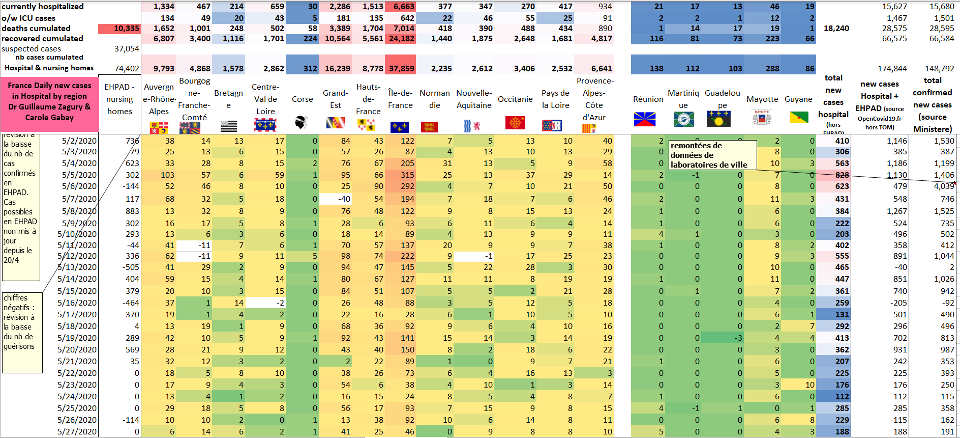
IV SPACE TIME TABLE: 3 Country Types (red-yellow-green)
II.C COVIDFLOW: The synthese tool
Example: Cuba
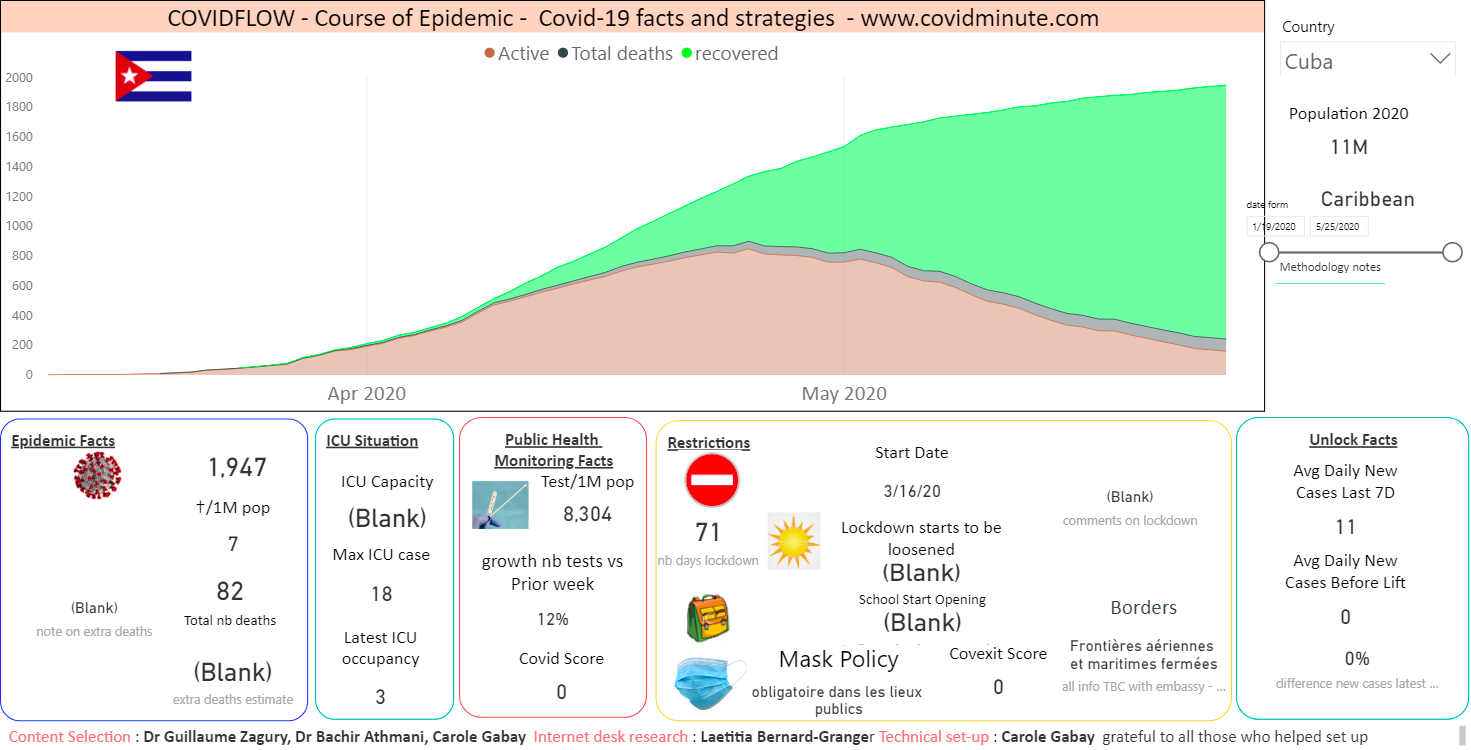
Our “Covidminute” team provides you with the “Covidflow” base (accessible on our platform: www. covidminute.com), and thus gives you all the important elements for 151 countries as well as the American states.
Keep in mind the “3M reflex” (Hands-Masques-Metre) to get protect and “reflex 4M” (Hands-Masques-Meter-… Minute) for frail people… but above all to protect the most vulnerable.
Confidence and solidarity for this collective struggle
Dr Guillaume ZAGURY
“All success is collective” thanks to:
o The entire “GCMN” (Global Covid Medical Network) “Medical” team: Dr. Bachir Athmani, Dr. Marc Abecassis, Dr. Mohamed Fadel, Dr. Emily Kara, Dr. Jean Michel Serfaty, Dr. Ibrahim Souare, Dr. Jonathan Taieb …) that allow this project to exist,
o The entire data analysis and IT team: Carole Gabay (“Data Analysis Expert”), Richard Coffre (exceptional webmaster), Flavien Palero (digital manager), Mathieu Bouquet (for his contribution passée)
o The whole “Communication” team (Flavien Palero, Laetitia, Marie, Alison…): without whom this project would not have been possible.
o All the historical financial patrons (Jérôme, Benjamin Denis and the Consulting Company B Square, Benoit Rossignol, Arnaud Bricout and TAG Advisory and Gilles Langourieux, Sabrina Rocca…) who work for “Citizen Actions”
o We also thank the Paul Benetot Foundation
If you feel like a patron or partner to fund development
computer (all the others have been volunteering for 88 days!), don’t hesitate to contact me (guillaumez888@hotmail.com).
Also, our team, although partly based in Shanghai, will be delighted to welcome you