We know that many journalists and decision-makers (“crisis cells”, ministries…) read this analysis “served for breakfast”, and we welcome it. We simply ask you, when you use our ideas or illustrations, to have the courtesy to quote us..
Dr. Guillaume Zagury, basedin Shanghai, a specialist in international public health and health innovations, comments for the Community on a day-to-day basis on the evolution of the epidemic for more than three months, and provides a preview of the elements of understanding on its “country and regions analysis” and predictable consequences (experiments of SARS in 2003 and Covid-19 in China).
A remarkable multidisciplinary volunteer team allows the realization of this analysis which is intended to be factual and objective (by the way, do not hesitate to join usre: mail below): “anysuccess is collective”.”.
Beyond the volunteer skills, this project was made possible by the support of our citizens’ vision patrons: the Paul Bennetot Foundation (Matmut Foundation under the aegis of the Foundation ofthe Future), B Square, Tag Advisory, Daxue Consulting, as well as various fellow travelers (Jérôme, Dr Benoît Rossignol, Gilles Langourieux… )
All our illustrations created for almost 100 days, will soon be available to you on our site and you can download a large part of them. (www.covidminute.com).
I. COVID “360 MINUTE”: graphs and maps (80% of the information)
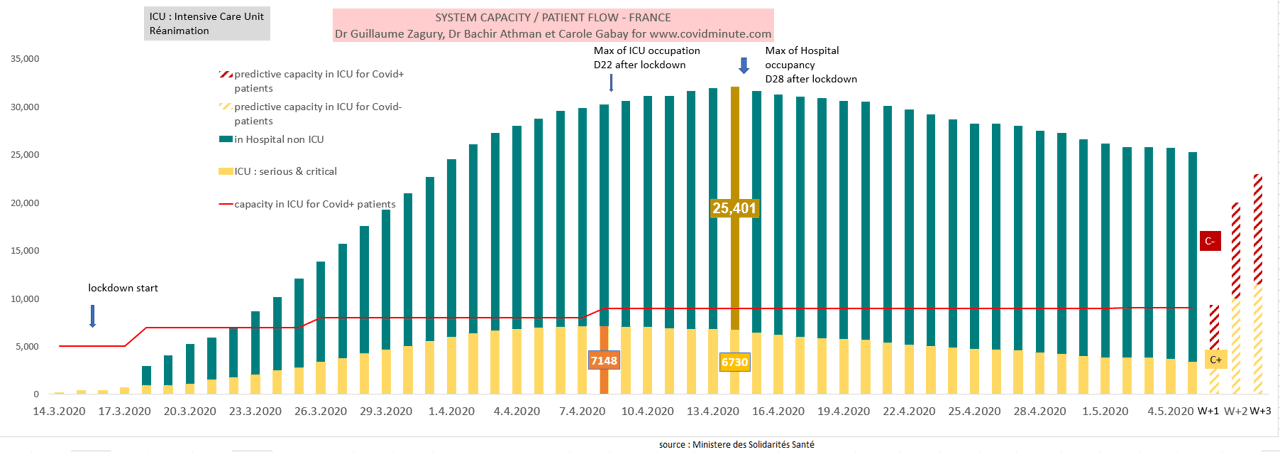
I.1 France – after 46 days of containment a favorable but slow dynamic
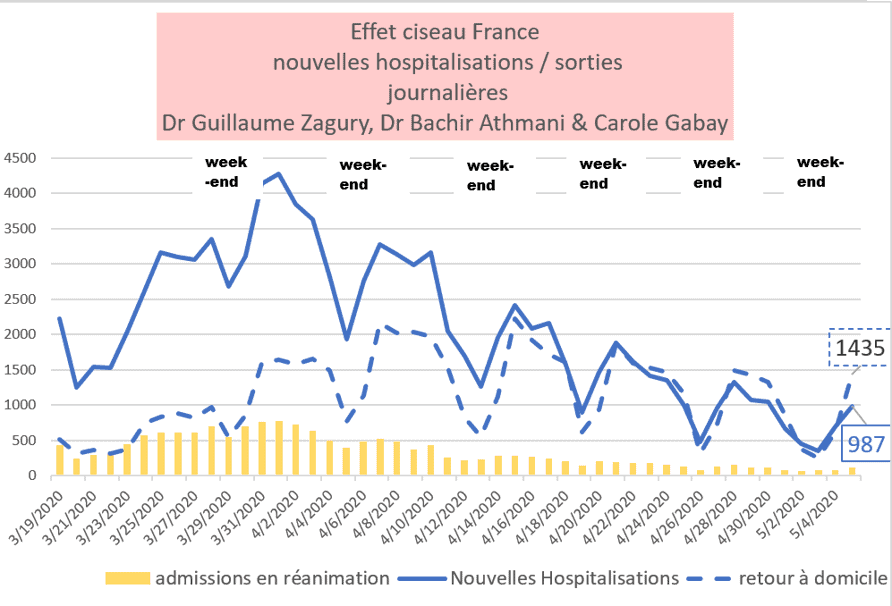
Scissor effect in progress (hospitalizations and resuscitation)
France: scissor effect in progress (Hospitalizations: more exits C than entries C) : note the WE effect (more outgoing on Tuesdays)
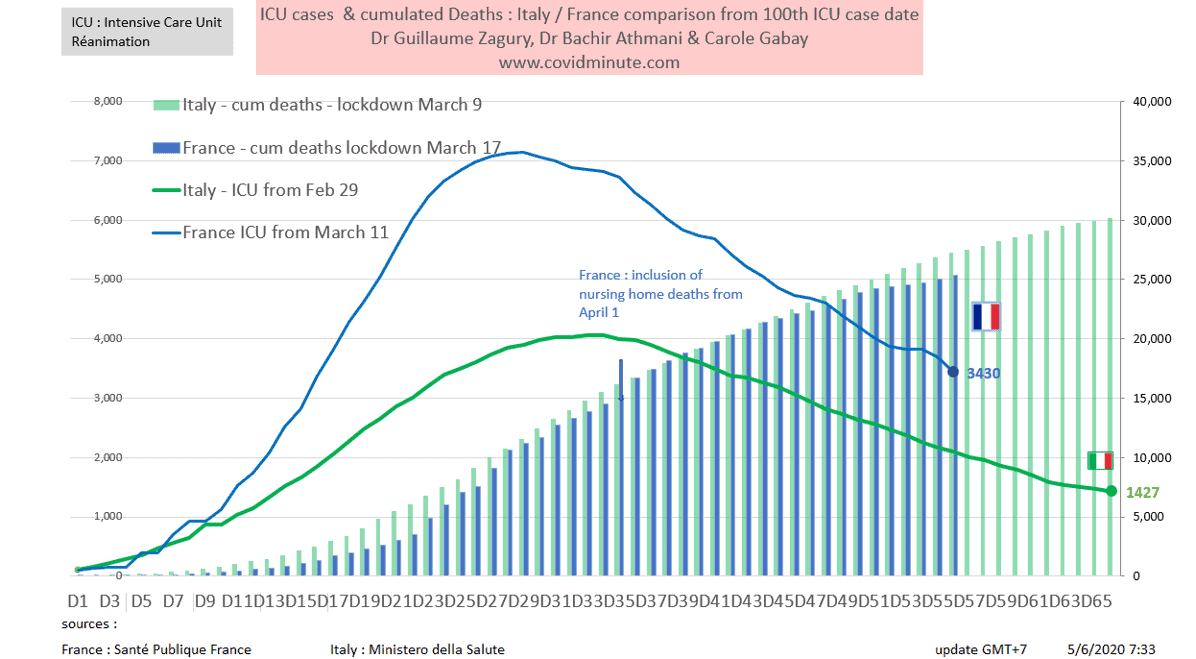
I.2 Vision time: we follow Italy with 10 days lag
Timeline ofresuscitation cases France/Italy
I.3 France – Forecast: resuscitation beds available (at stake from 16 May)
The Cova beds () below 4000 today (3430 versus 3827 yesterday) with a maximum capacity to date estimated at 9000 beds.
Post-disconfinement projection, based on 3 elements: historical data, incubation time (J7 with an upsurge to be expected around 16 May), and the influx of patients C (-) (around 3330 out of 7183 occupied beds)

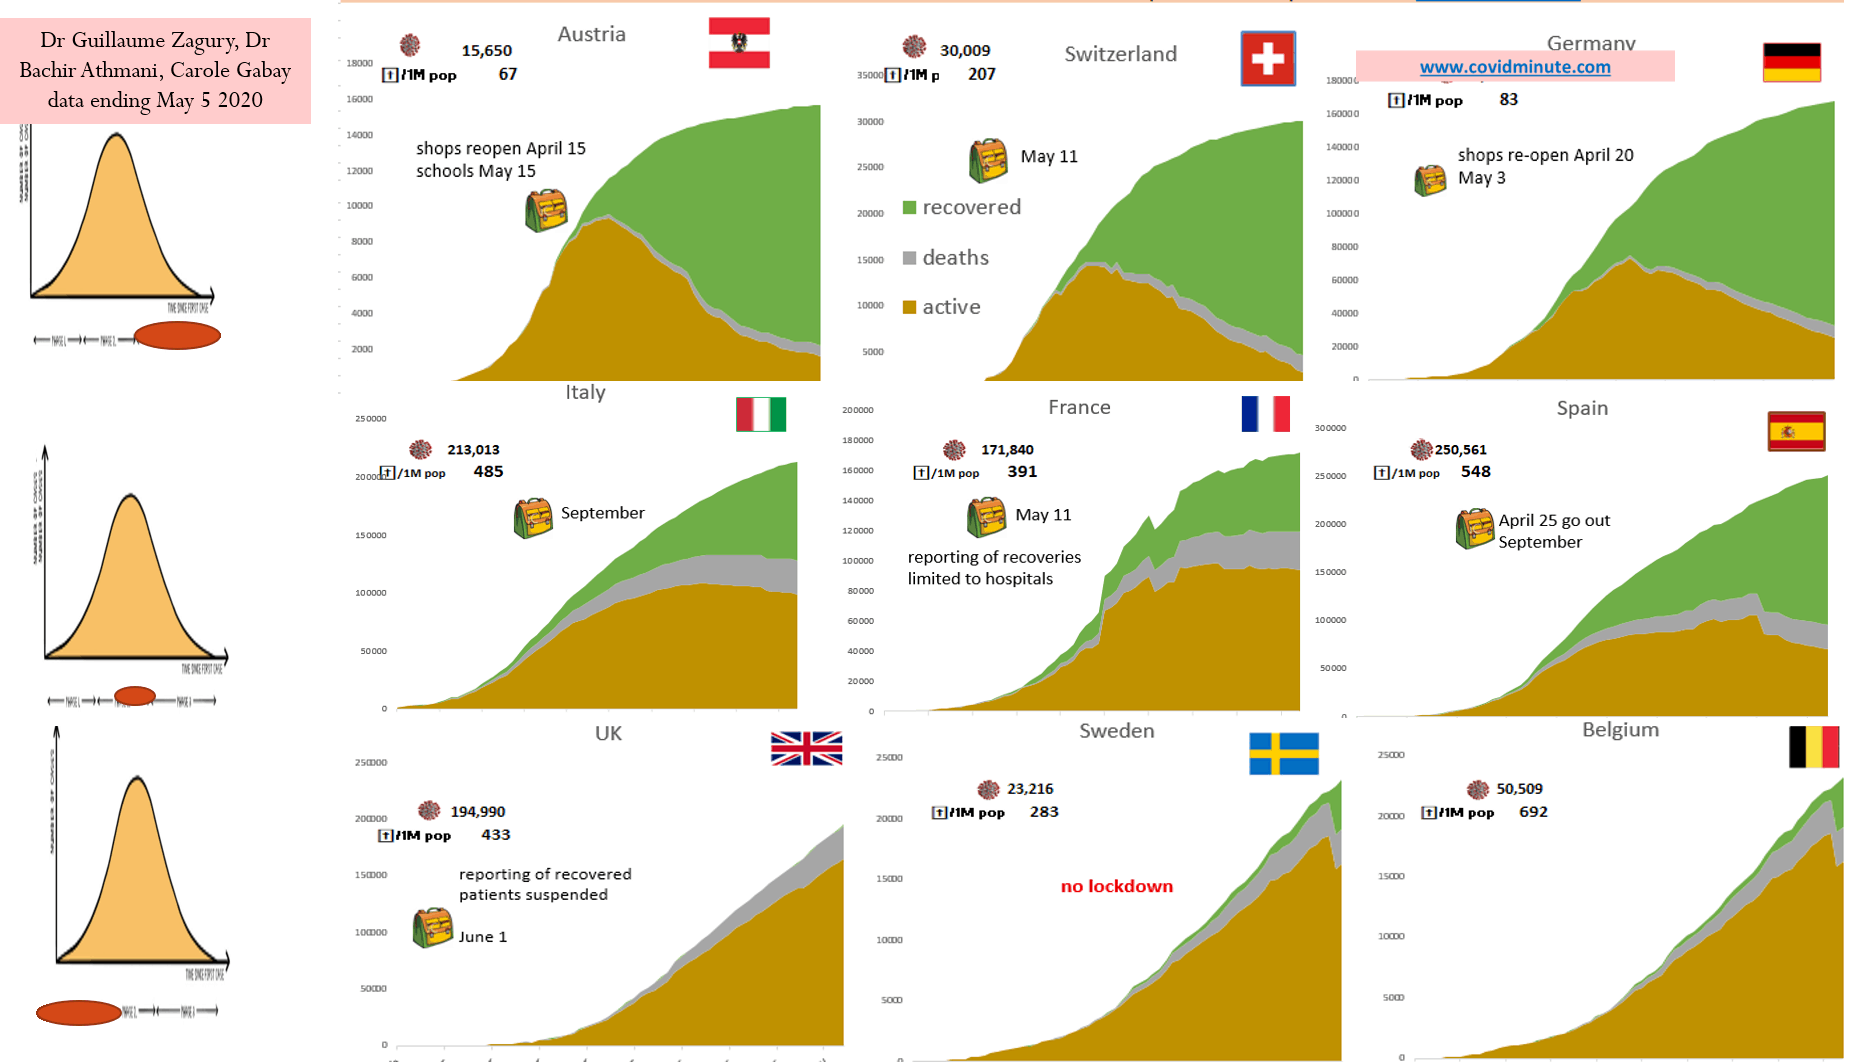
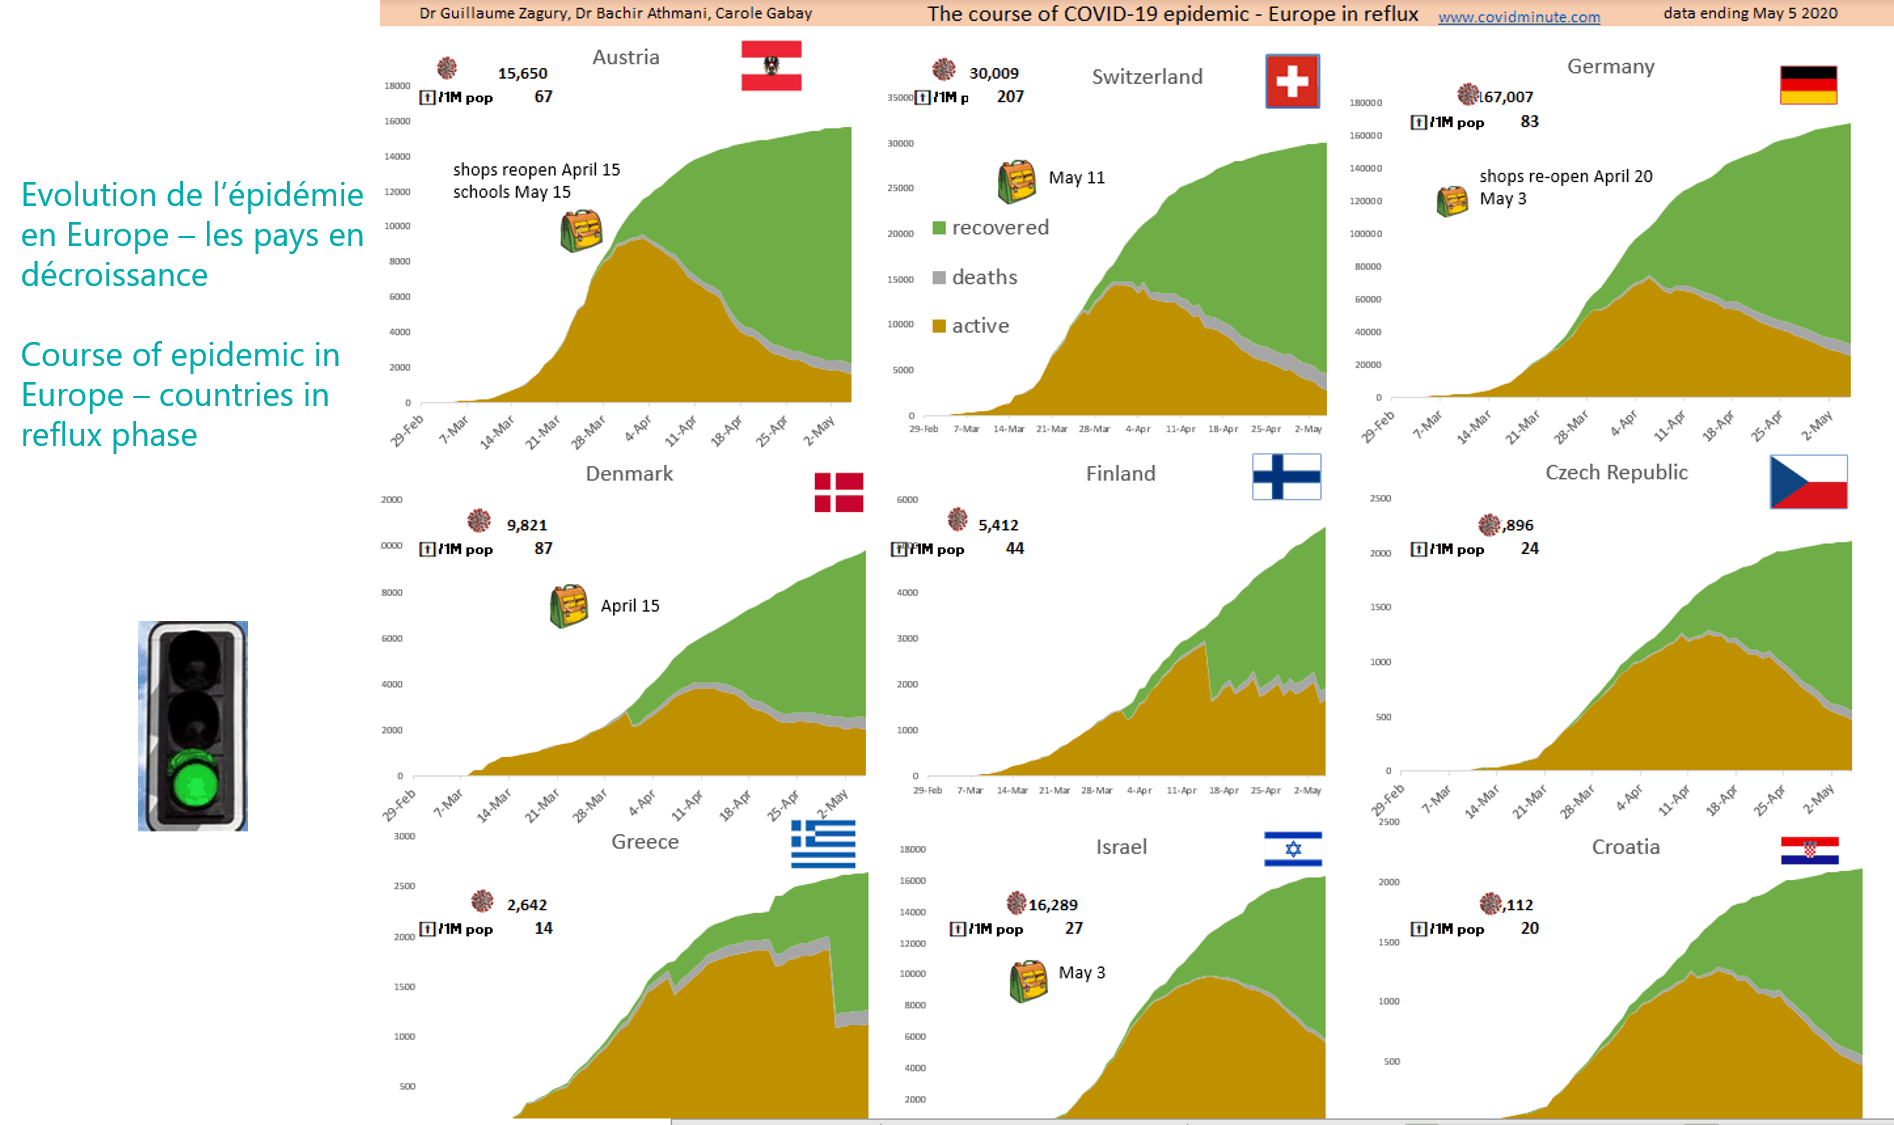
I.4 Europe: A3-speed Eu rope: peak passes (disconfinement) – plateau – epidemic phase.
Note that in France, Ephad patients cured or non-hospitalized patients, are not counted in the”healed” and as a result, the flex (importance of the “green”) of the curve is in reality stronger than the graph vision
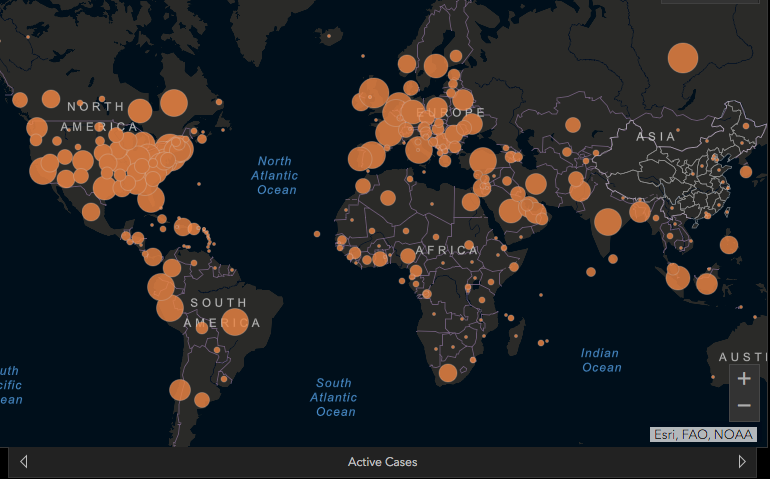
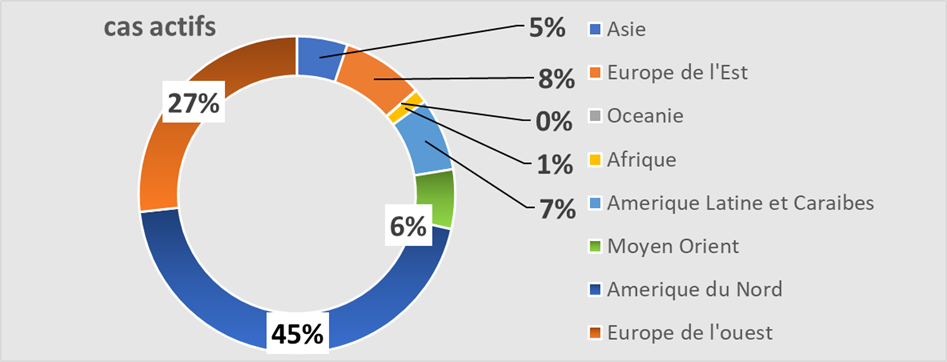
I.5 Epidemic Mapping (Reported Active Cases):Uk and Russia are the second and third active outbreaks
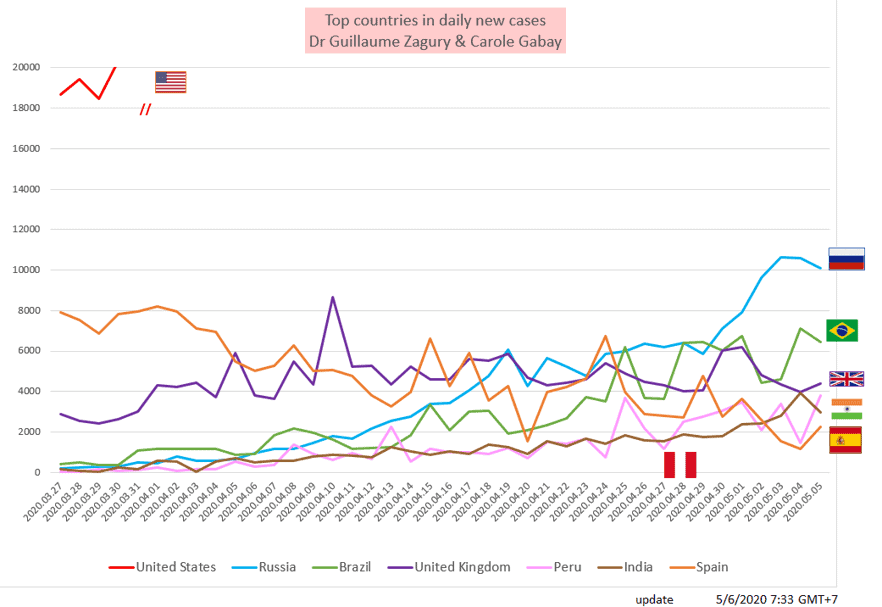
I.6World: Watch the BRI (Brazil-Russia-India)
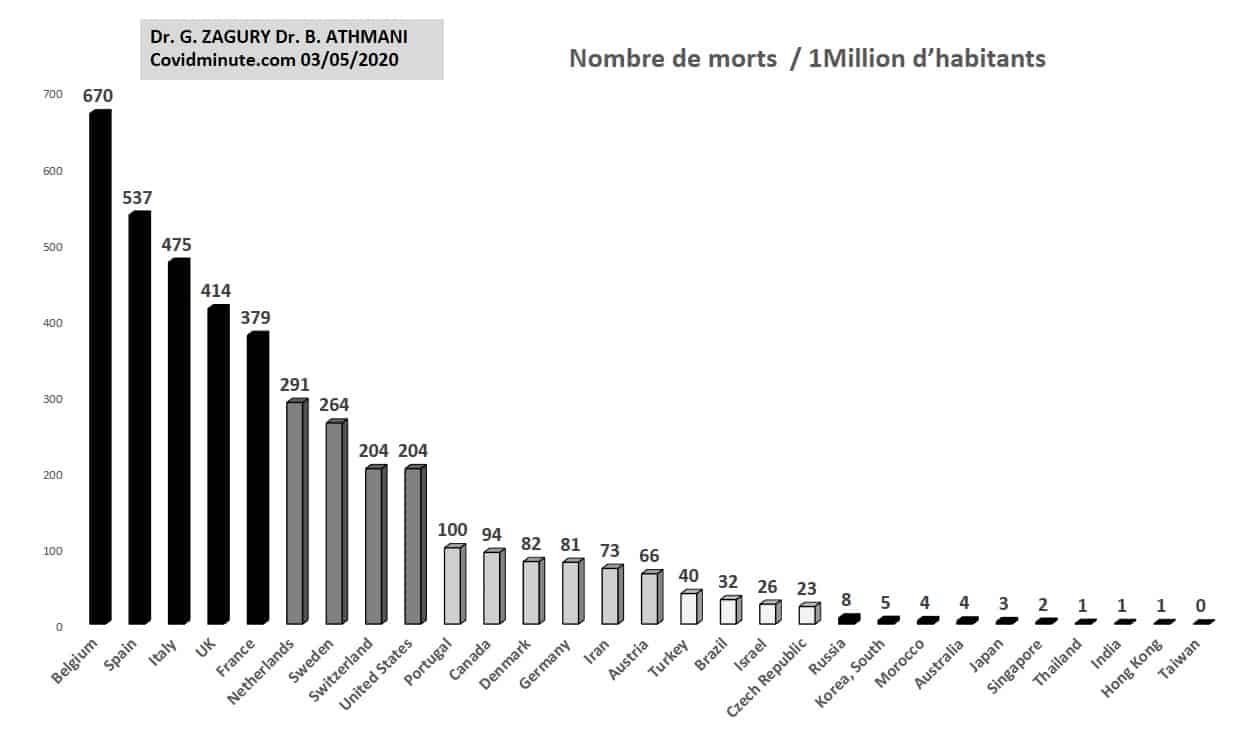
I.7 World – Outcome Indicator – Mortality / 100k individuals: 3 levels observed
Comparative international results of “country strategies”
Indicator certainly not perfect (because depending on the tests, the population density, the median age of the country… ) but available to assess the impact of “Country” strategies.
Beware, however, of too hasty comparisons (see Finland or Australia has low population density versus Singapore or New York)

II. 360-degree analysis
Ⅱ.A To Africa indirectly protected from the Covid, by its human development index (very small proportion of 65/ northern countries)?
With my colleague, Dr. Bachir Athmani, we evaluated more than a month and a half ago the different health systems facing massive potential influxes of patients (“Crash Test” section of our site covidminute.com): 15% have severe forms requiring hospitalization and 5% stay in medical resuscitation for 2 weeks usually, based on experience in China (including more than 90% of cases in Hubei). Africa had been analysed and we are monitoring it.
Ⅱ. A.1 Facts
A lot of uncertainty in the figures provided because they are dependent on the available tests…
What is certain: if the resuscitations were full, it would be known.
A.1.1 Times: First cases in North and South Africa since mid-February
The majority of cases reported in Africa come from an import from European countries, while several African countries (Algeria, Egypt,South Africa) are considered by international experts to be the most threatened by the arrival of coronavirus originating in China (presence of a large community of Chinese expatriates: cf Ethiopia…). It should be remembered that more than 65% of the mobile phones sold in Africa are ofChinese origin…
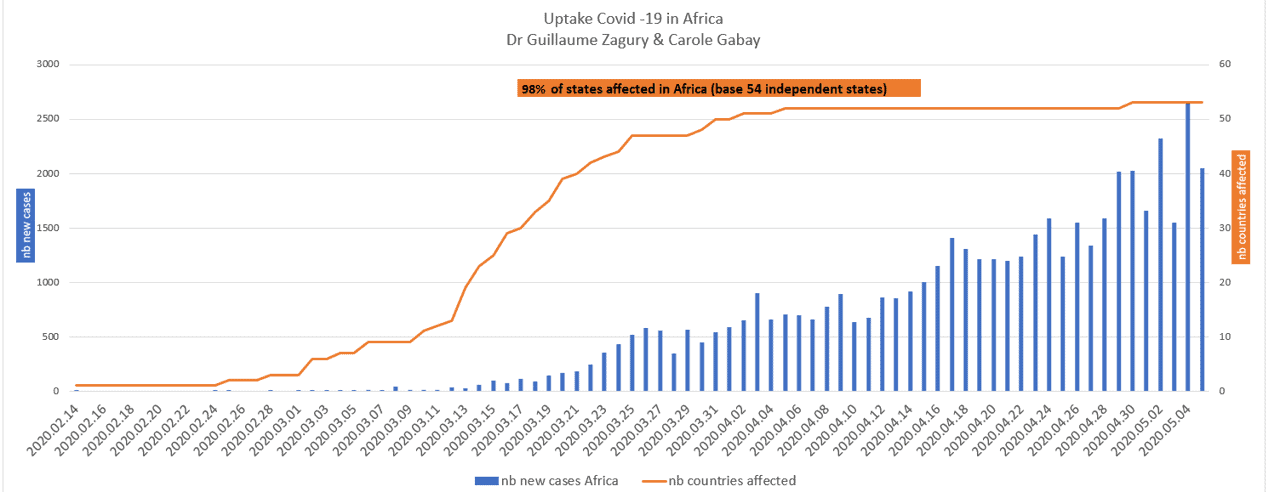
II.A.1.2 Space: 98% of the 54 served states
Africa/World – less than 1% (attention bias of measurements by low number of tests) of the more than 3 million historical cases
Distribution in Africa: 1/3-1/3-1/3 North Africa (37%) – West Africa (34%)- East Africa – South Africa
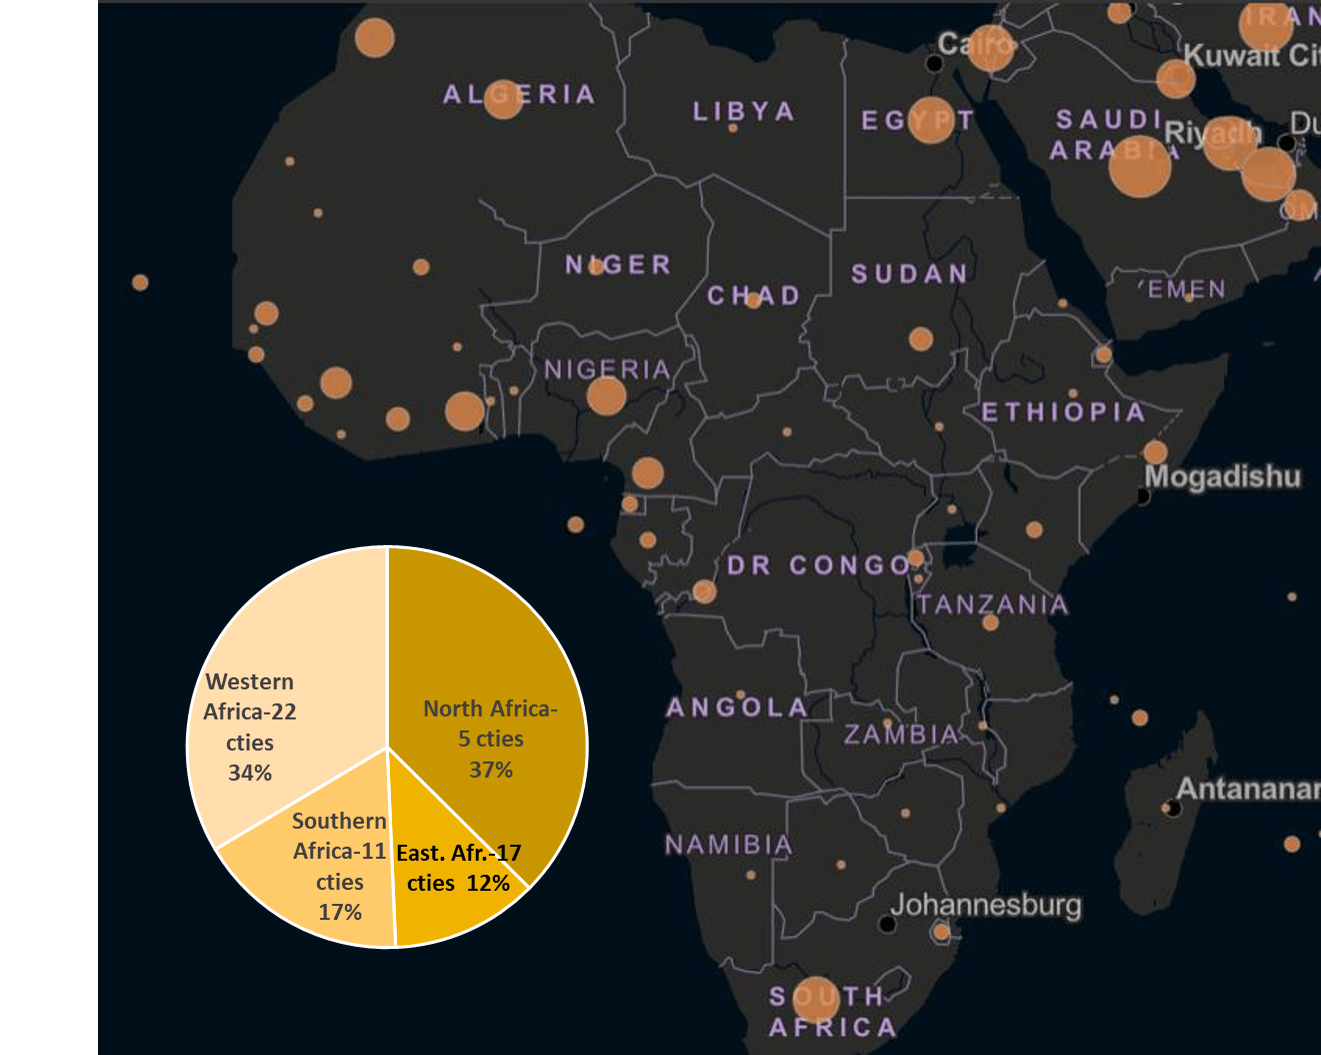
By country: Full picture on our website – www.covidminute.com
Ⅱ. A.3 Probable results: less than 2000 deaths reported Covid, versus more or less 100 times more in Europe (150 k deaths)for a triple population (1.5 Billion/550M)
Although we must be careful about measurement biases, at the continental level, we observe a mortality/M hbt rate of: 1.43 (versus 192 in Europe) … a ratio of 1 to more than 100. In Côte d’Ivoire, for example, fewer than 30 deaths have been recorded.
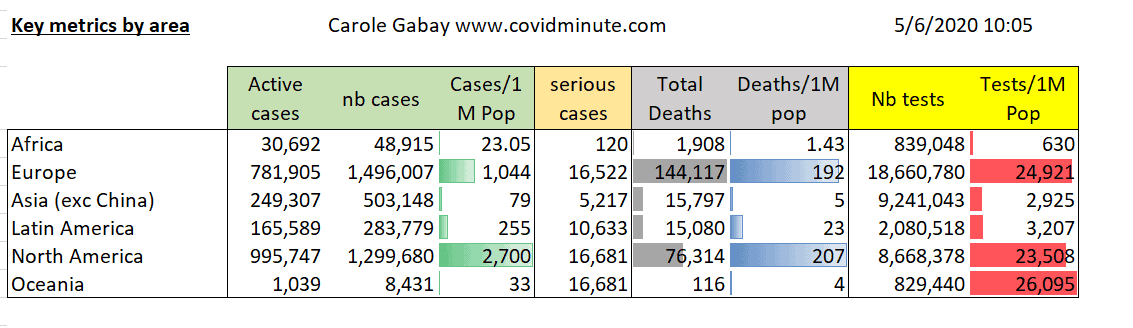
At the country level (watch out for measurement): The 1st African country (Algeria) is ranked 31st (cf www.covidminute.com)
Ⅱ. A.4 The 3 main protective factors we used in our previous “Crash Test: Africa”
In our opinion, the major factor: age.
African populations are generally young (60% of the lagos population is under 20 years of age) with low comorbidity (obesity, chronic respiratory failure…). Our demographic iconography speaks for itself with 7 times less than 65 years in Africa than in France (Europe).
However, we know that deaths due to Covid (and to a lesser extent admissions to resuscitation) are primarily age-related: 71% of deaths in France are over 75 years of age and 90% of deaths are over 65 years of age. Regarding hospitalizations in France, 70% of those over 65.
Also deaths attributable to associated comorbidities: in China, less than 1% of deaths were among people without chronic comorbidity (found to be more than 20% for obesity, 15% for respiratory failure…)

The temperature effect is possible but could be explained by a measure: civilizations of the sun (Africa, Brazil, India, Thailand… ) are above all “young” countries and this effect takes precedence over the physical aspect(temperature, humidity…).
Epidemiological studies in Australia will be interesting to decide.
The possible “chloroquine” effect (potential anti-inflammatory activity interesting in Covid) with more than 36 million platelets sold last year, but this will have to be prouve over time.
Ⅱ. A.5 Now that we are rather reassured about the absence of an outbreak (type Europe or USA)
… the cure must not be worse than evil: “We will first die of economic death before dying of biologic death” (The Governor of HK in 2003 at the time of Sars)
We cannot maintain populations that have to move (food… ) and work (informaleconomy… ), on pain of hunger revolt orriots..
With the possible exception of a few potentially risky cities, the economy needs to pick up.
Ⅱ. A.6 Size Equation: Covid is now an epiphenomenon in Africa, while remaining vigilant about certain cities or potential outbreaks
If about 2000 deaths were recorded in Africa in 3 months (by ling this would give 8000/year), this figure must be brought back to the infectious reality of the Continent: more than 600,000 deaths for Hiv (usually young men and women)and 450,000 deaths for malaria (60% less than 5 years).
As a result, the activity must gradually resume or risk adding a double punishment to our African friends: social disorder in addition to health risk.
II.B Europe: Countries that have decommated
II.C France – evaluation
II.C.1 Persistent scissor néanmoins effect with still close to 1000 hospitalizations per day despite 46 days of confinement:
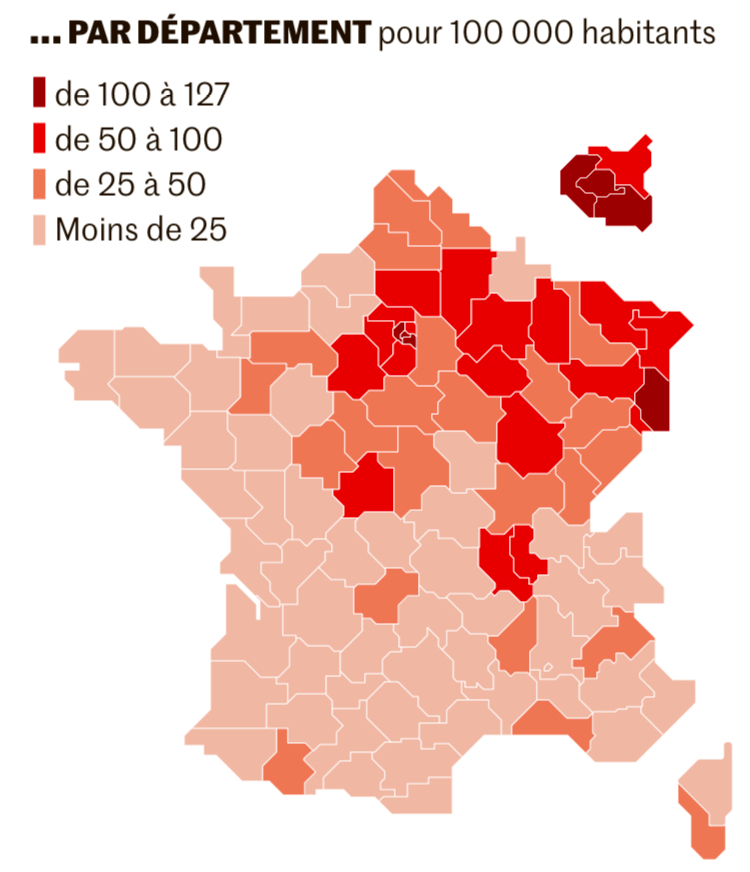
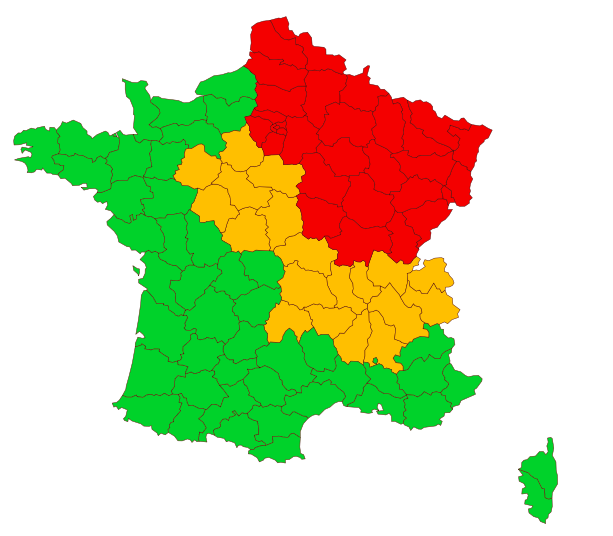
II.C.2 Preparing for disconfinement – departmental vision: East-West and North-South gradient
II.C.2.1 Virus circulation: density of cases in the territory
II.C.2.2 Combination of the two factors: case density and available resuscitation beds (red: 2 negative indicators – orange 1 indicator – green: 2 positive indicators)
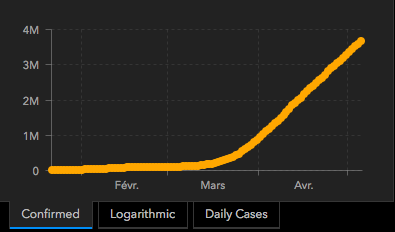
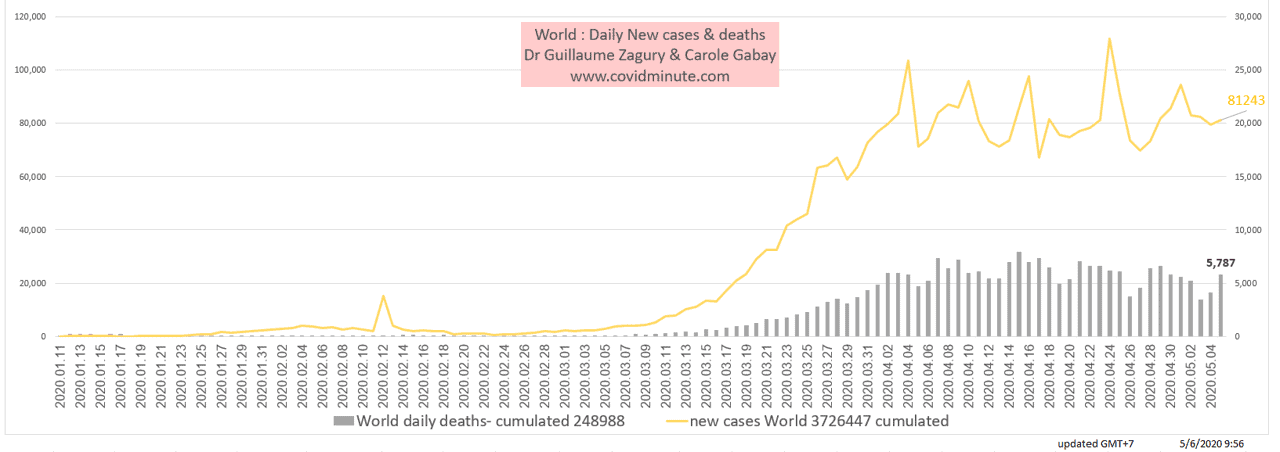
Ⅱ.D WORLD: The 4 million reported cases cross
With the contribution of Dr. Bachir Athmani, Stéphane and Flavien Palero, companions of the first hour, whom I thank again for their unwavering support.
Beware of certainfigures (number of cases, deaths…) that are highly questionable because they vary from country to country (e.g. availability of tests), with measurement biases and therefore major under-reporting in some countries.
By continent
II.D.1 Prevalence: 2,225,000 active cases confirmed for observation

Epidemic growth since January 1: Nearly 4 million cumulative cases
Geographical vison: 4 active poles: Americas, Europe, Middle East, Russia.
By continent: Africa 1% of reported cases
Top 10 countries: cf full country table on: covidminute.com
United States 965k (yesterday 958k)
United Kingdom 165k (yesterday 162k)
Russia 134k (yesterday 126k)
Italy 98k (yesterday 100k)
France 92k (yesterday 93k)
Spain 70k (yesterday 71k)
Brazil 59k (yesterday 55k)
Turkey 53k (yesterday 56k)
Netherlands 36k (yesterday 35k)
Peru 34k (yesterday 32k)
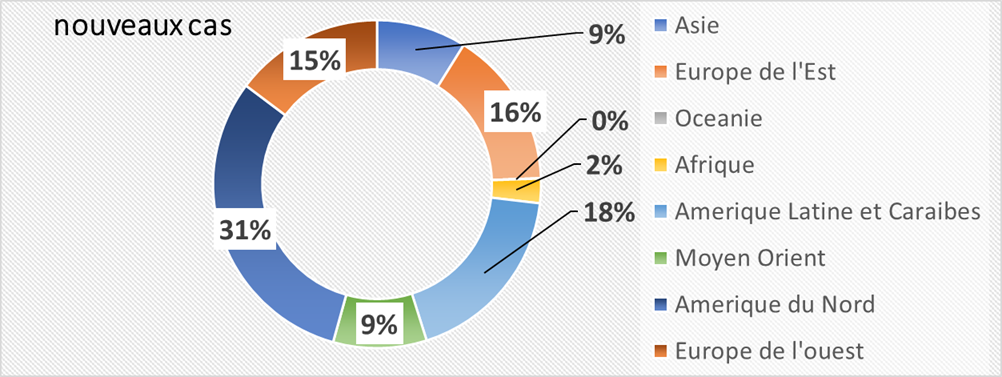
Ⅱ.D. 2. Impact: BRI (Brazil-Russia-India) in epidemic phase?
79,000 new cases detected yesterday

Depending on the weather:
Geographical
Continent: more new cases in Russia than in Europe
By continent: More new cases in Eastern Europe than in Western Europe
By Country
United States 23k (22k yesterday)
Russia 10k (11k yesterday)
Brazil 6k (7k yesterday)
United Kingdom 4k (4k yesterday)
Peru 4k (3kyesterday)
India 3k (4kyesterday)
Keep in mind the “3M reflex” (Hands-Masques-Meter) to protect yourself and “reflex 4M” (Hands-Masques-Meter-… Minute) for frail people (and caregivers)
… but above all to protect the most vulnerable.
Confidence and solidarityin this collective struggle
Dr Guillaume ZAGURY
- “Allsuccess is collective,”thanks to:
- The entire “Medical” team of “GCMN” type (Global Covid Medical Network): Dr. Bachir Athmani, Dr. Marc Abecassis, Dr. Mohamed Fadel, Dr. Jean Michel Serfaty, Dr Ibrahim Souare, Dr Jonathan Taieb…) that make this project a muste,
- The entire data analysis and IT team: Carole Gabay (“Data Analysis Expert”),Richard Coffre (exceptional webmaster), Flavien Palero (digital manager), Mathieu Bouquet (for his past contribution) )
- The whole “Communication” team(Flavien Palero, Laetitia, Marie, Alison… ” ( ): without whom this project would not have been possible.
- All the historical financial patrons (JeromeJérôme, Benjamin Denis and the Consulting CompanyB Square, Benoit Rossignol, Arnaud Bricout and TAG Advisory and Gilles Langourieux, Sabrina Rocca…) working for “Citizen Actions”
- We also thank the Paul Benetot Foundation
- If you feel like a patron or partner to financethe computer development (all the others have been volunteering for 88 days!), please contact me (guillaumez888@hotmail.com).
- Also, our team, although partly based in Shanghai, will be delighted to welcome you … because it is not the work that is missing… !
[DISPLAY_ULTIMATE_SOCIAL_ICONS]