Source: Politico
Dr. Guillaume Zagury, based in Shanghai, who specializes in international public health and health innovations, comments for the Community on a day-to-day basis on the evolution of the epidemic for more than three months, and provides a first-of-the-art understanding on its “country and region analysis” and predictable consequences (experiments of SARS in 2003 and Covid-19 in China).
A remarkable multidisciplinary volunteer team allows the realization of this analysis which is intended to be factual and objective (by the way, do not hesitate to join us: mail below):”anysuccess is collective”.”.
Beyond the volunteer skills, this project was made possible by the support of our citizens’ vision patrons: the Paul Bennetot Foundation (Matmut Foundation under the aegis of the Foundation of the Future), B Square, Tag Advisory, Daxue Consulting, as well as various companions (Jérôme, Dr. Benoît Rossignol, Gilles Langourieux, Sabrina Rocca,… )
All our illustrations created for more than 100 days, will soon be available on our website and you can download a large part of them. (www.covidminute.com).).

I. COVID “360 MINUTE”: graphs and maps (80% of the information)

I.A France – Deconfinement . Day 1: still 500 new hospitalizations per day despite 55 days of confinement.
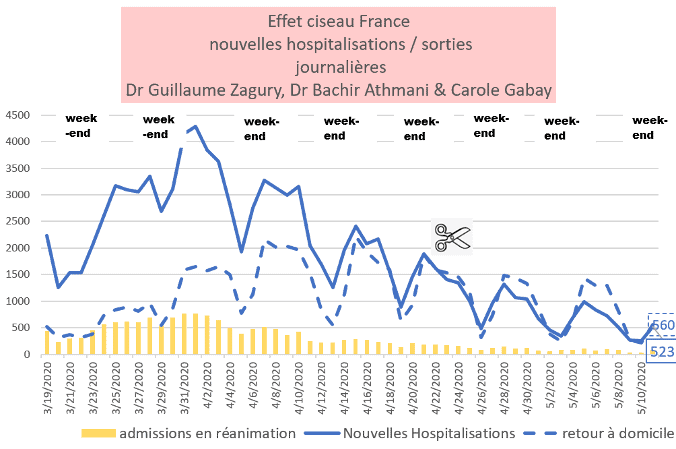
Note also, that in France as everywhere in Europe the number of daily deaths fell below 300 (we were in an average of around 600 deaths/jr between 8-29 April).
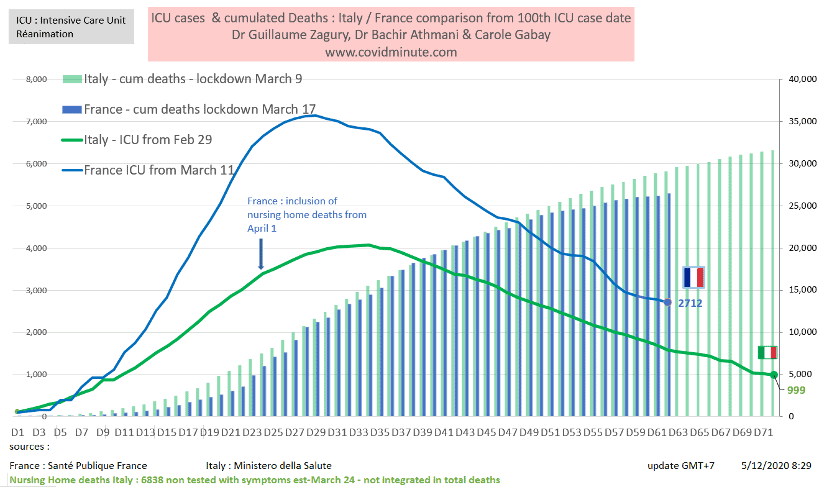
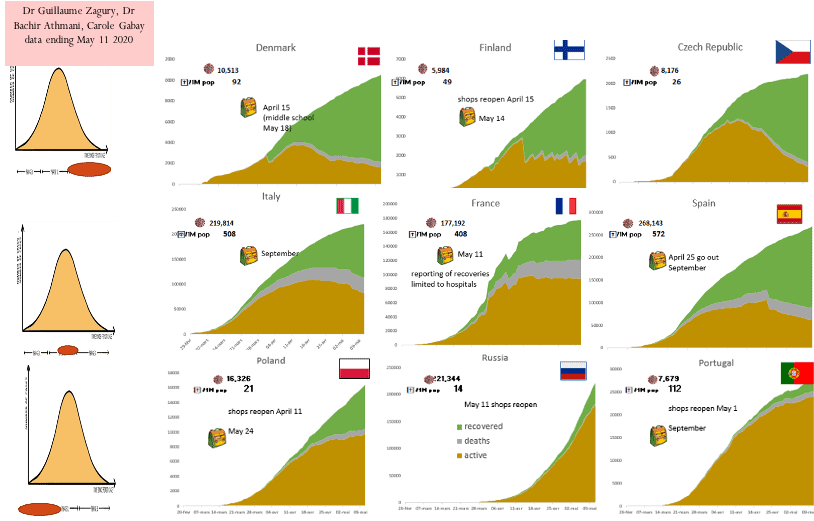
I.B Vision time: we follow Italy with 10 days lag.
It should be noted that Italy has fallen below 1000hospitals in ICU
Comparative chronological evolution of resuscitation cases France/Italy
I.C France – Post-disconfine forecast: resuscitation beds available – the issue from 16 May
The curative system will have a hard time with a “second wave” C(+) especially as the C(-) that will gradually return
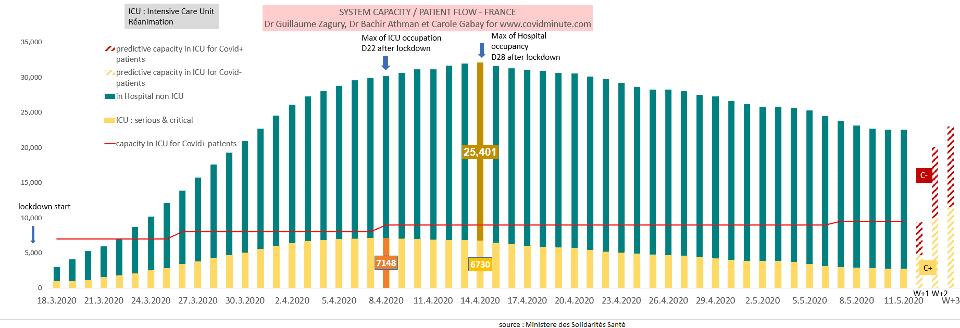
The date of 16 May, where vigilance should be increased, is due to deconfine (increased viral transmission) to which the average duration of viral incubation has been added: 5 days.

I.D Europe: a 3-speed Europe: past peak (deconfinement) – plateau – epidemic phase.
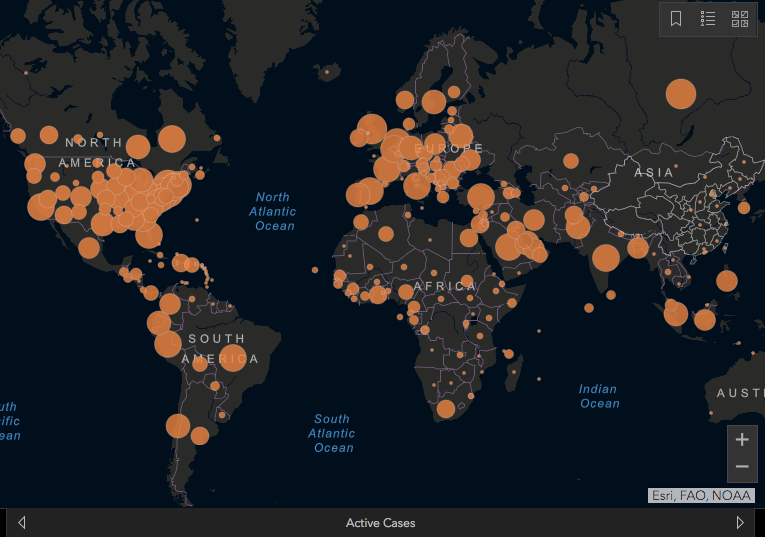
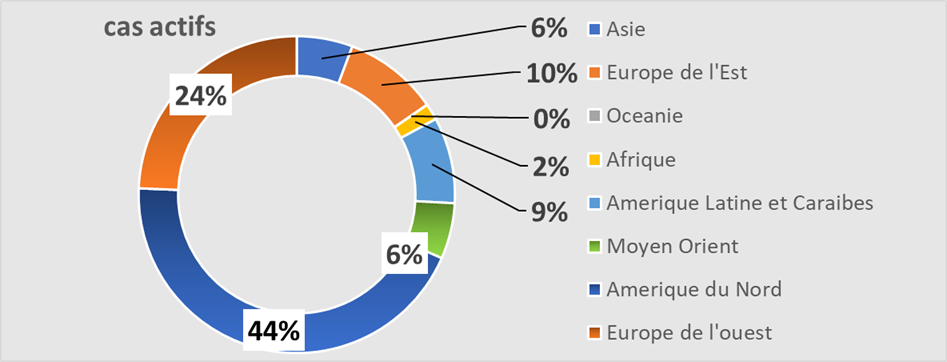
I.E Epidemic Mapping (reported active cases)
5 active households (North America, Latin America, Europe, Middle East, Russia) and nearly 50 “Wuhan”
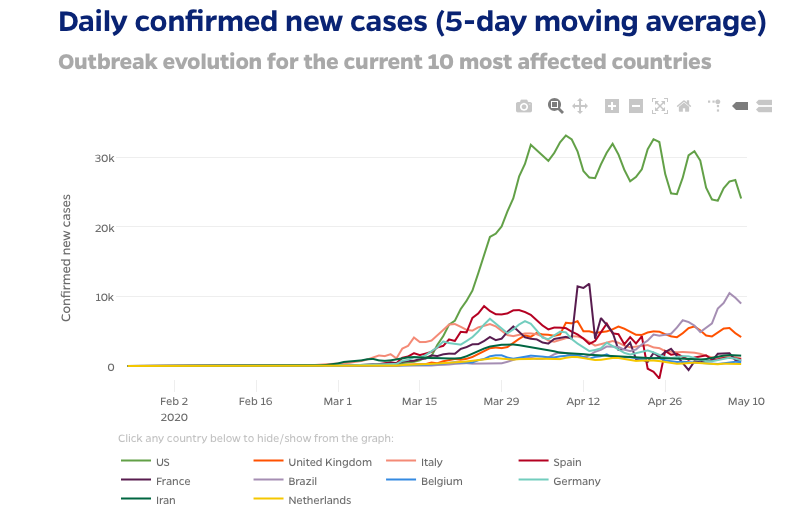
I.F World: Latin America in epidemic phase with a number of new daily cases tending to reach the USA (with probable under-reporting …)
20% versus 30% of new cases reported (with the usual reserves on this type of figure-dependent)
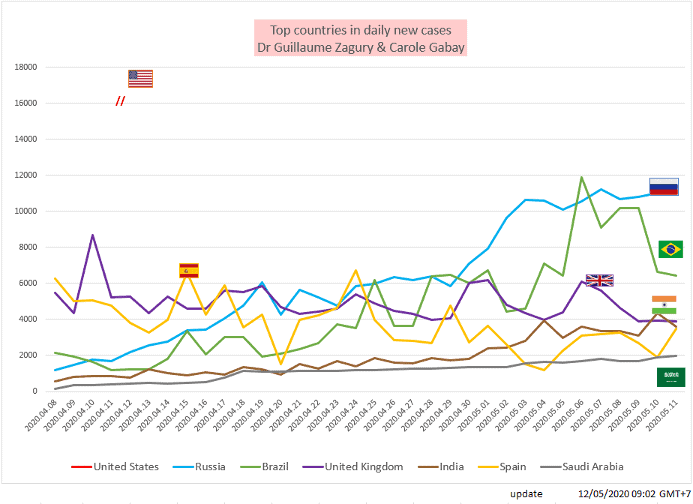
Title: Top 10 Countries by Number of New Cases C (+)Reported

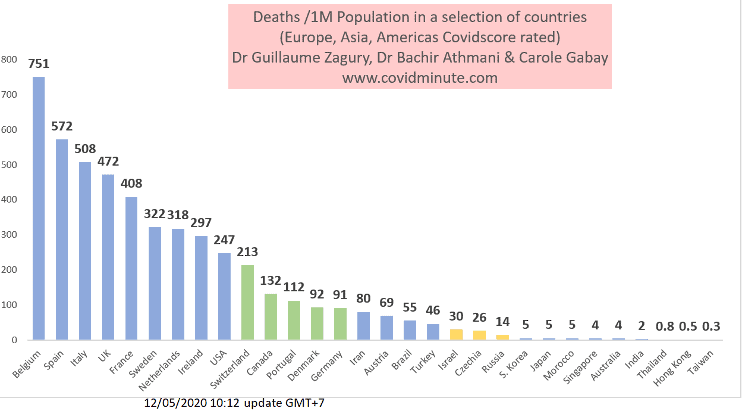
I.G World – outcome indicator – mortality / 100k individuals: 3 levels observed
Comparative international results of “country strategies”
Indicator certainly not perfect (because depending on the tests, the population density, the median age of the country… ) but available to assess the impact of “country” strategies.
Beware, however, of too hasty comparisons (see Finland or Australia with low population density versus Singapore or New York)
II. Analyse 360°
II.A Geopathology “USA”
Less than 6 months from the November 3rd elections: the economy will make the election, even if the health record will be unfavorable
Let’s remember our 2 previous analyses (www.covidminute.com):
- “Crash Test”: the American health care system: March 18, 2020 (D51)
- “Presidential USA” D-200: November 3, 2020 (J83 )
The evolution confirms the lack of preparation of the American health system, focused primarily on the curative (with the technological prowess we all know), and very much on the preventive and social (see abolition of Obamacare). So let’s look at the concrete results/announcements of the President.
II.A.1 The figures announced at the beginning by the President: 100-200 k deaths
Why the number? A rule of 3 compared to the worstEuropean scenario. In Italy, the death toll is expected to reach around 30,000 deaths per 60 million people. As the United States is 5 to 6 times more populous, 30 x 6 – 150 to 180,000 deaths.
II.A.2 The gross figures of the Covid observed at J 108 (1st case on 23/1/2020)
- 1.35 MillionCases C ()Historical
- 1 Million Active Cases Currently Reported
- 80,000 deaths (or 6.1% of diagnosed cases)
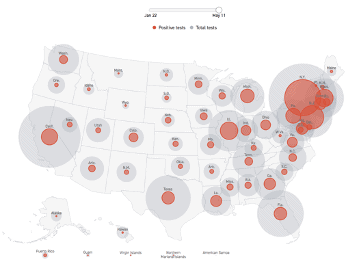
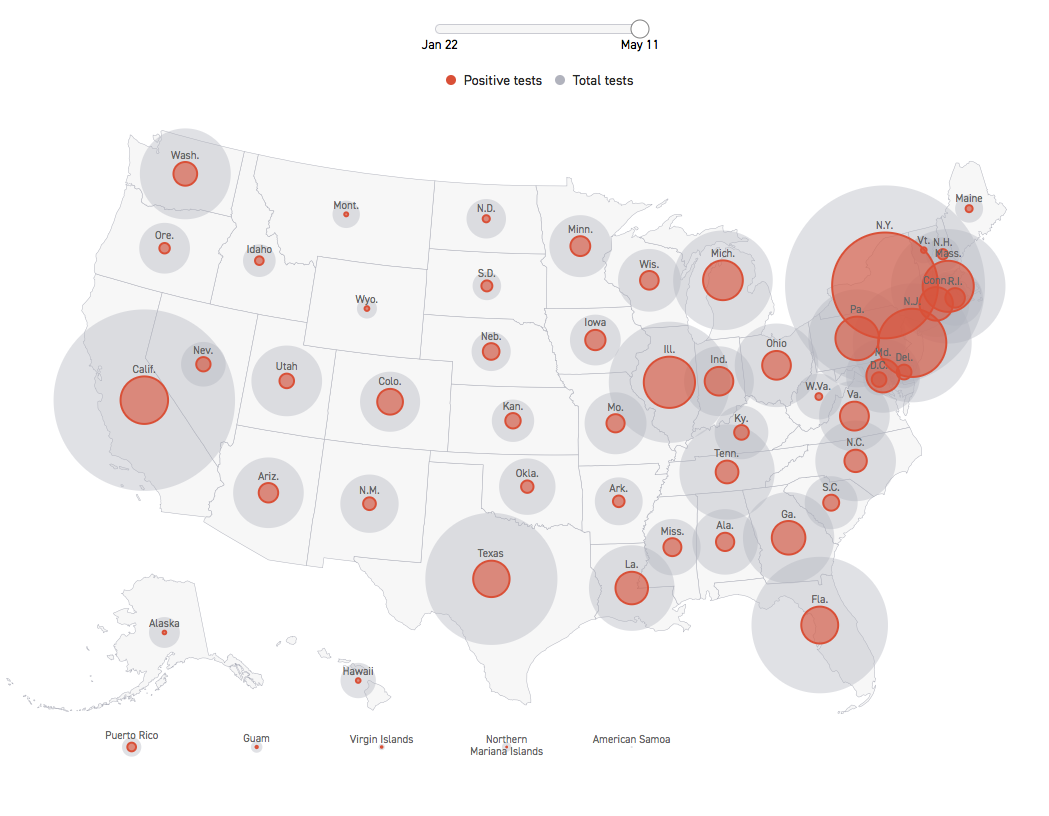
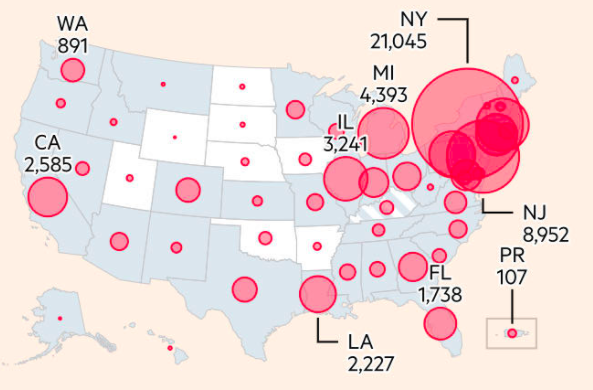
II.A.3 Covid impacted the United States with an East-West and Urban-Rural double gradient:
For example, New York currently accounts for nearly 30% of the 80,000 victims
Geographic distribution of deaths:
II.A.4 3 A plateau effect in sight, with 2 favorable arguments:
II.A.4.1 Number of new cases per day: A very complete table (time/space) is provided on the site www.covidminute.com
From more than 25,000/dr since the beginning of April (with a peak on April 24 to 38,000 new cases) has 18,000 yesterday.
II.A.4.2 The number of hospitalizations in resuscitation (objective fact) appears to be stabilizing:

II.A.5 A result indicator
(Certainly questionable but available) that will eventually place the United States at the level of Western European countries see above (see3 weeks between observed cases and deaths):
II.A.5.1 If in Etats gross numbers the United States is clearly more affected given the population (350M):
80,000 deaths while the plateau is just emerging
II.A.5.2 Relative figures are not favorable in the long term
USA – 247 deaths/Million inhabitants while the plateau seems just on the way to being reached: cf iconography A/7.
II.A.6 The President must therefore accept the health reality
But must give priority to economic health(the historic state of the American elections)
The President must embody three dimensions to his electorate:
He must be an economic champion: maintain his image by relaunching as soon as possible the economic machine, which is currently “gross”:17 million unemployed with little or no unemployment benefits, GDP lost more than 6%and Wall Street experienced its biggest historical fall.
It must be a champion of individual freedoms: demonstrations observed in Michigan (even if in other states whose governors are Democrats) for the lifting of confinement….
It must embody a “health leadership” through its communication: obviously, its communication service will find a comparative ratio (local and international) to show that management has been acceptable and that decisions taken (intensive tests,,..) were the right ones.
II.A.7 Scapegoats all found to make the initial shortcomings forget
II.A.7.1 Outdoors
China: “Chinese virus,” “accountability,” “possibility not excluded from the cause in Wuhan’s P4 laboratory” …
WHO: incompetent and in Beijing’s pay by concealing information that would have been crucial for prevention (hencea budget withdrawal of $500 million, or 20% of the WHO budget)
II.A.7.2. Internally
Democratic governors in some states “under pressure”: New York, California, etc.
His “health safety” team, which was recently thanked for a lack of competence
II.A.8 In terms of communication and whatever
The health outcome, the President will be “The right man at the right place in the right moment”
If the medical and health check is:
– Positive, the government has made the right decisions
– Negative, the local governors have made the wrong decisions, but your President has defended you against an external threat (China) and allowed the economy to start again (for the remaining 180 days before the November 3rd election).
Ⅱ. B and C: EUROPE and FRANCE: Tomorrow
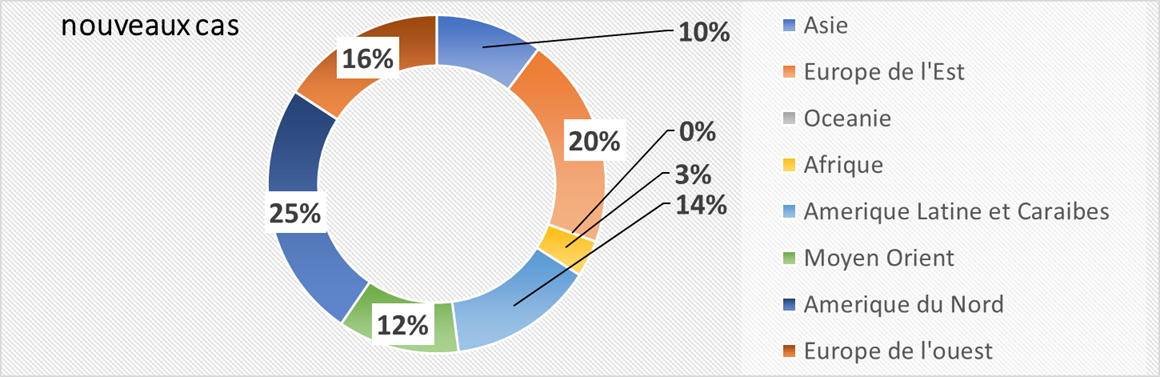
Ⅱ. D WORLD: The 2 Americas and Russia in epidemic phase with about 20% of new cases
With the contribution of Dr. Bachir Athmani, Stéphane and Carole Gabay, companions of the first hour, whom I thank again for their unwavering support.
Beware of certain figures (number of cases, deaths…) that are highly questionable because they vary from country to country (e.g. availability of tests), with measurement biases and therefore major under-reporting in some countries.
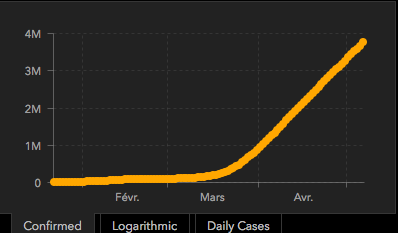
Ⅱ. D.1 Prevalence: 2,437,000 active cases confirmed for observation

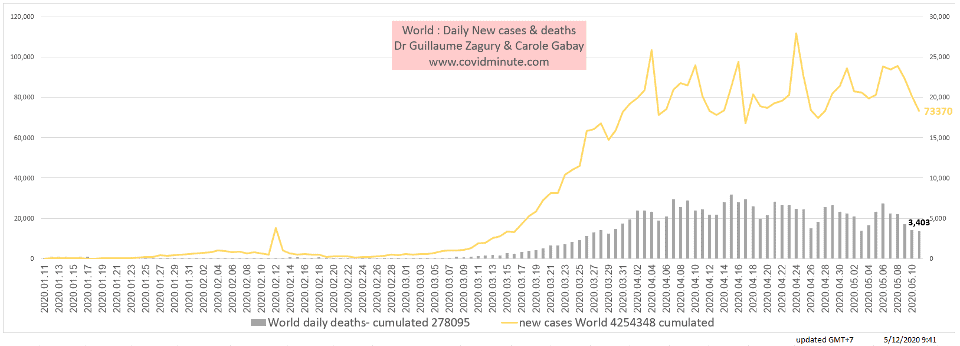
Timeline: Epidemic growth since January 1: 4.1 million cumulative historical cases
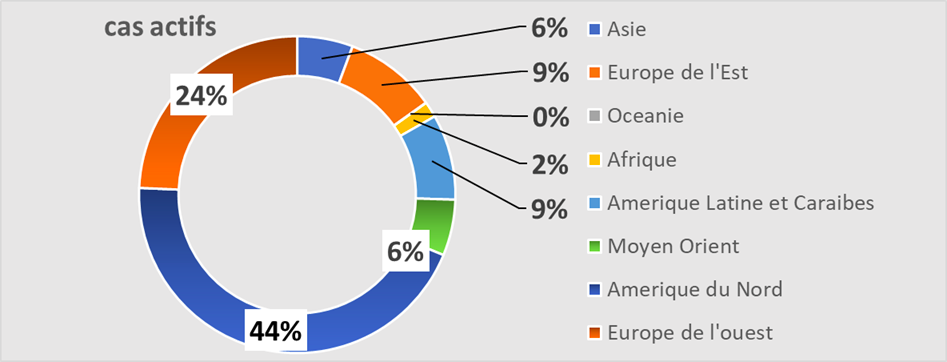
Geographic vision:
By continent: 5 households – North and South America (likely under reporting),) , Europe, Middle East, Russia – iconography in minute analysis
Top 10 countries: full country table (time /space) on: www.covidminute.com

United States 1041k (yesterday 1044k)
United Kingdom 191k (yesterday 187k)
Russia 180k (yesterday 173k)
France 94k (yesterday 94k)
Brazil 90k (yesterday 90k)
Italy 82k (yesterday 83k)
Spain 64k (yesterday 62k)
India 46k (yesterday 44k)
Peru 44k (yesterday 44k)
Turkey 40k (yesterday 42k)
Netherlands 37k (yesterday 37k)
Ⅱ. D.2. Impact: 68,000 new cases detected yesterday

By continent
Depending on the weather:
Geographic:
By continent: More new cases reported in Russia than in Europe
By country
USA 16k (18k yesterday)
Russia 12k (11k yesterday)
United Kingdom 4k (4k yesterday)
India 4k ( 4kyesterday)
Brazil 3k (10k yesterday)
Spain 3k (2k yesterday)
Pakistan, Iran, Saudi Arabia, Qatar, United Arab Emirates, Kuwait, Bangladesh, Belarus, Turkey, Italy, Germany, South Africa, Canada, Mexico, Chile, Peru, Colombia: 1 to 2k
All the tables of our Data Analysis Expert, Carole Gabay, on the website: www.covidminute.com,in the “Resources” section.
[DISPLAY_ULTIMATE_SOCIAL_ICONS]