India with an obvious under-declaration, is to be observed very closely (fortunately very young population).
————————————–
The CovidMinute team has been offering analyzes on Covid19 since January 28. Your support is essential to continue to maintain our team. Thank you for your support.
———————————
Minute Analysis:
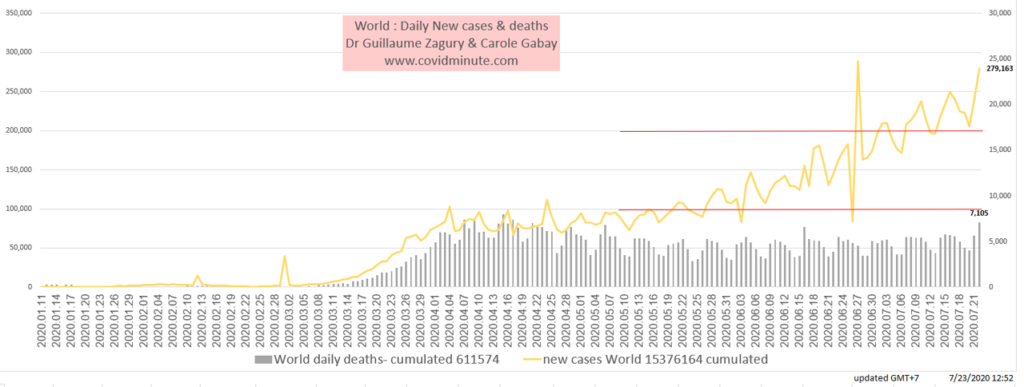
1/ World incidence:
new cases detected (“dependent test”) reach peaks (150-200k) in many countries (India…), but daily mortality remains “stable” (less than 5000 deaths/dr).
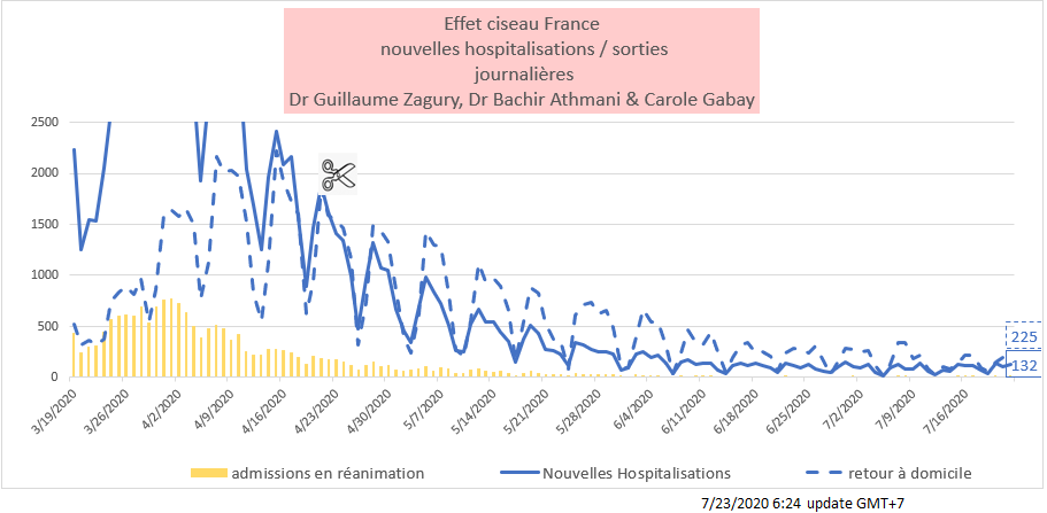
2/ FRANCE: 180K cases (and 30k deaths) after
If the conventional indicators (hospitalizations, resuscitation, deaths) continue their favorable evolution, let us remain vigilant, the virus is still circulating, but in a controlled manner:
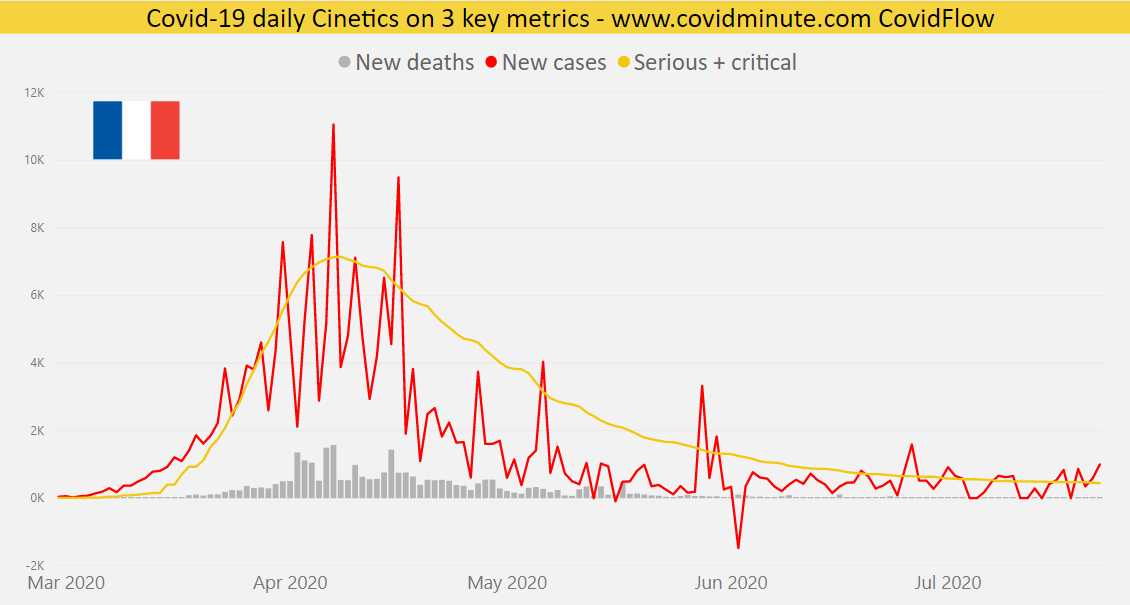
– Hospitalizations: a total of 6482 people (versus 6,983 /J7)
– Resuscitation: also down, 455 patients (versus 492 / J7).
– However, let us remain cautious because some “weak signals” require vigilance:
Always between 500 and 1000 new cases/dr (see dependent tests: currently the test positivity rate is around 1%)
Hospitalization dynamics (average 7 days) are above 100/per (first time in a month)
Always a hundred existing clusters “under control” and some territories in potential epidemic alert: Guyana (very young population), Finistère, …
epidemic kinetics in countries with winter climate similar to our
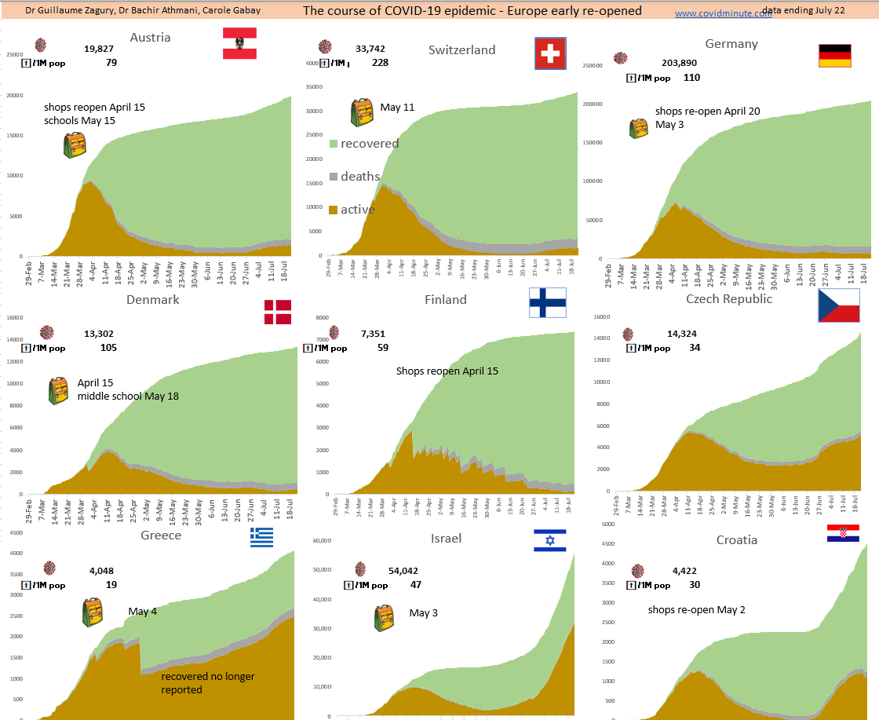
3/ EUROPE:
Good overall dynamics, but vigilance as evidenced by the recent partial confinement in Spain (Barcelona 4M of people in peak tourist season), Germany (North Rhine-Westly), England (Leicester…)
3.1 Good global dynamics
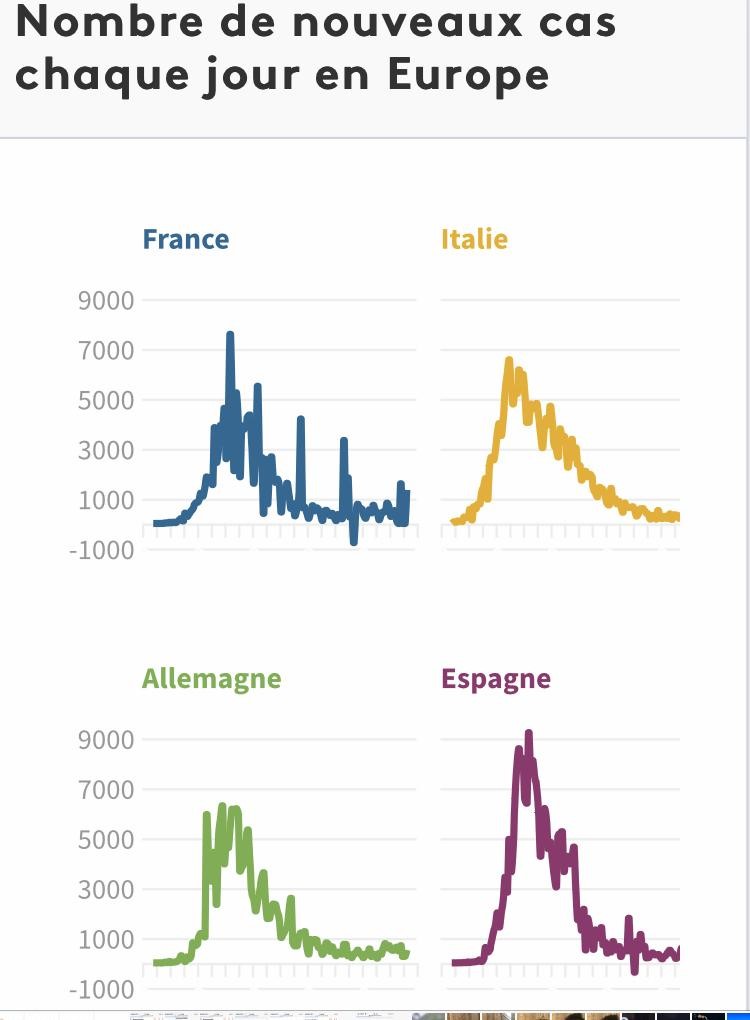
3.2 Some countries to watch: Israel, Croatia, Greece….
4/ AT THE GLOBAL LEVEL: THE EPICENTRE IS STILL IN THE AMERICAS
4.1 GEOGRAPHIC VISION:
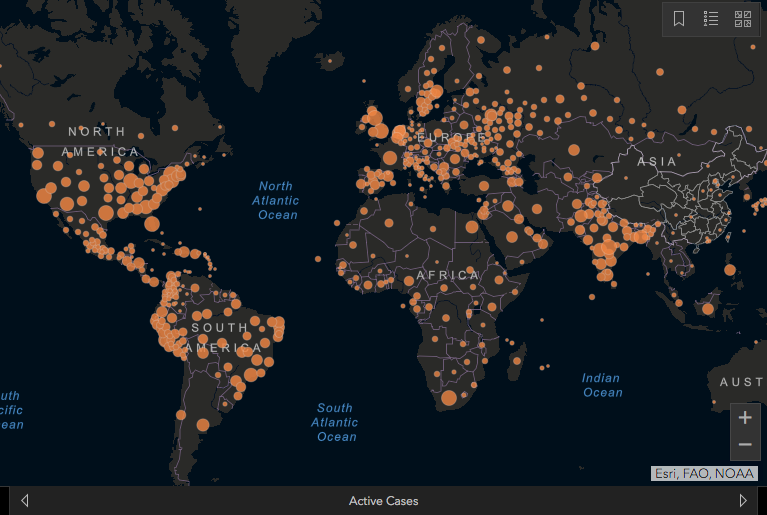
4.2 Prevalence OF ACTUAL CAS: THE AMERICS and INDES
4.3 EVOLVING DYNAMICS: LET’S MONITOR INDIA (UNDER DECLARATION):
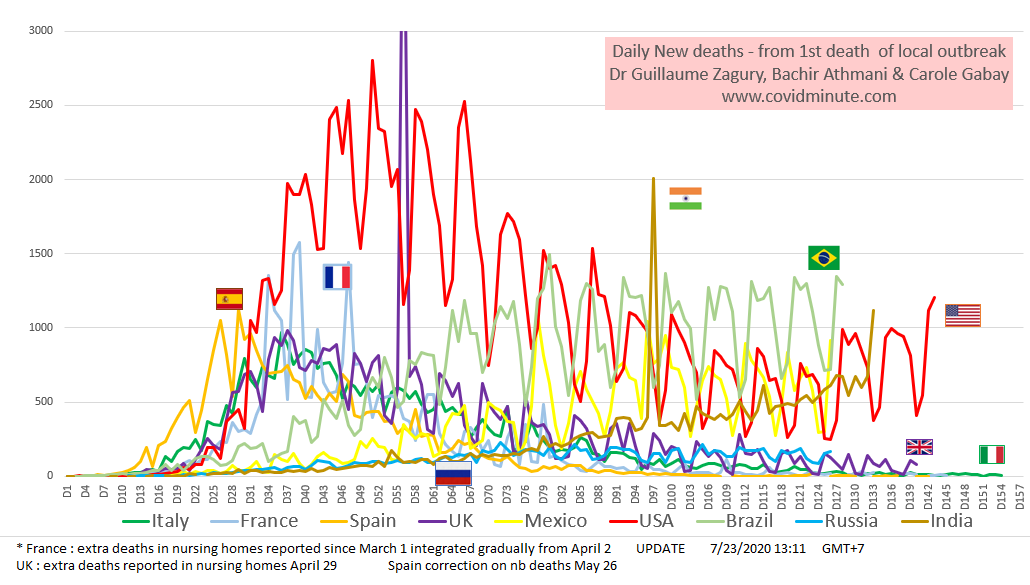
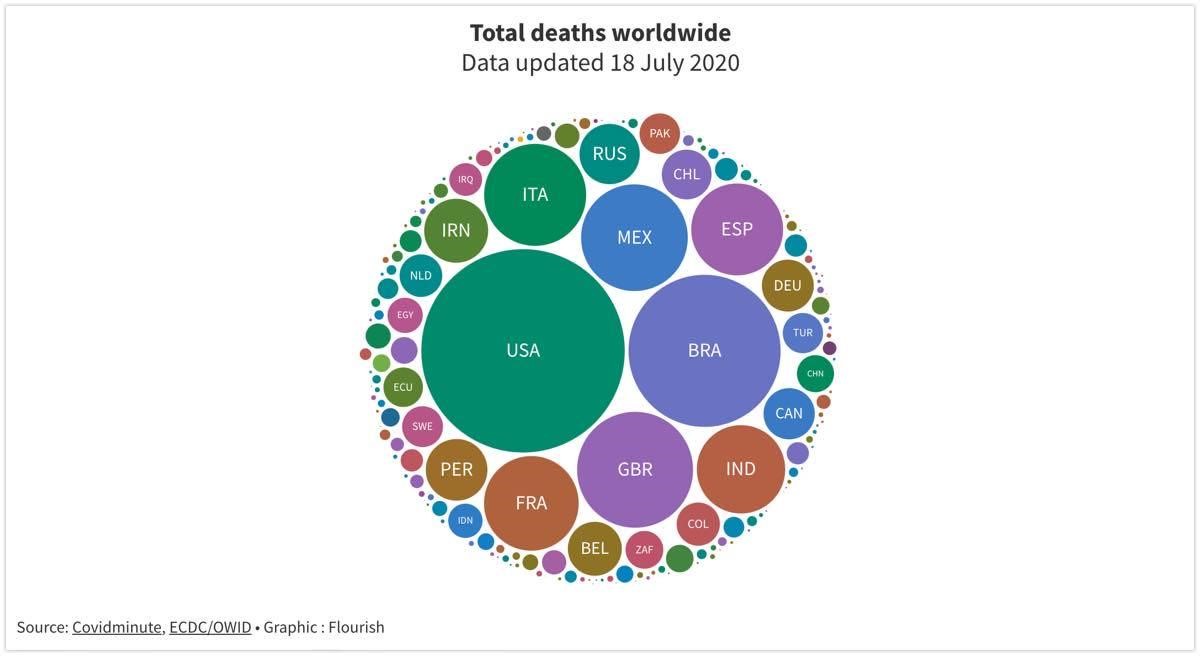
Top 10 countries: deaths/day.
Some experts estimate that the number of cases is very much underestimated in India, possibly by a factor of 10….
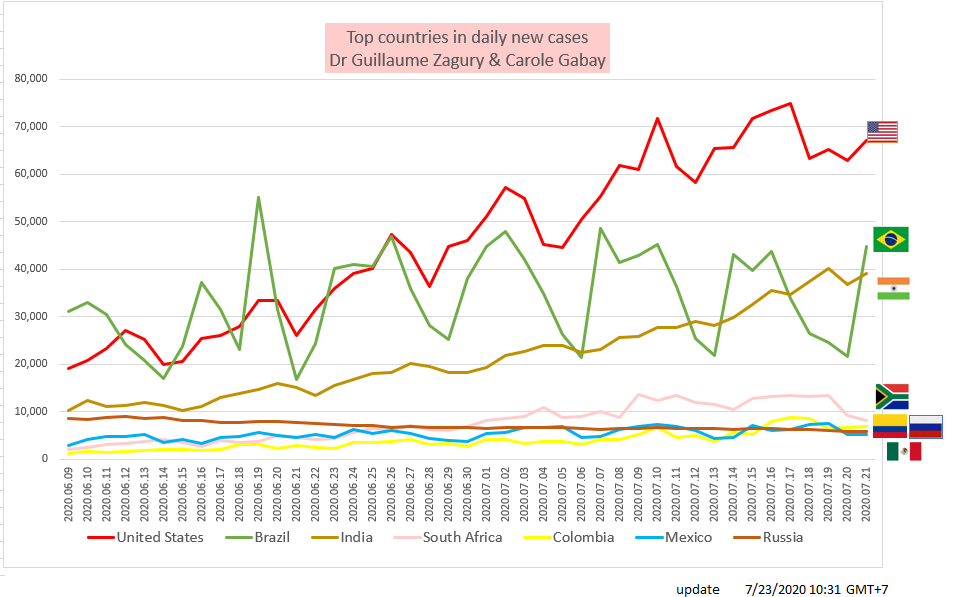
5/ COUNTRY APPROACH
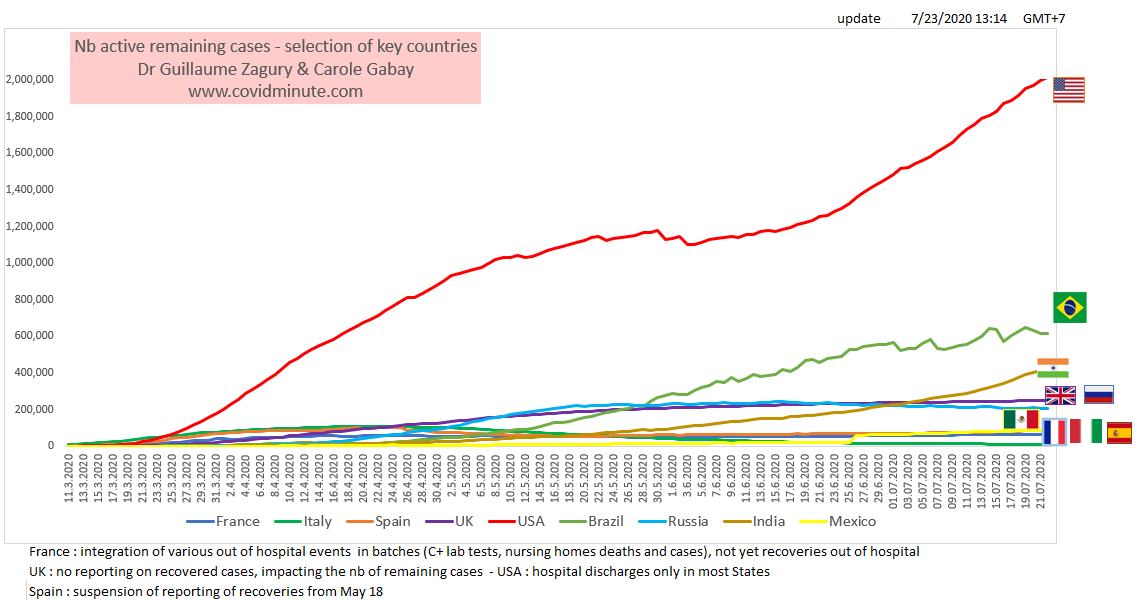
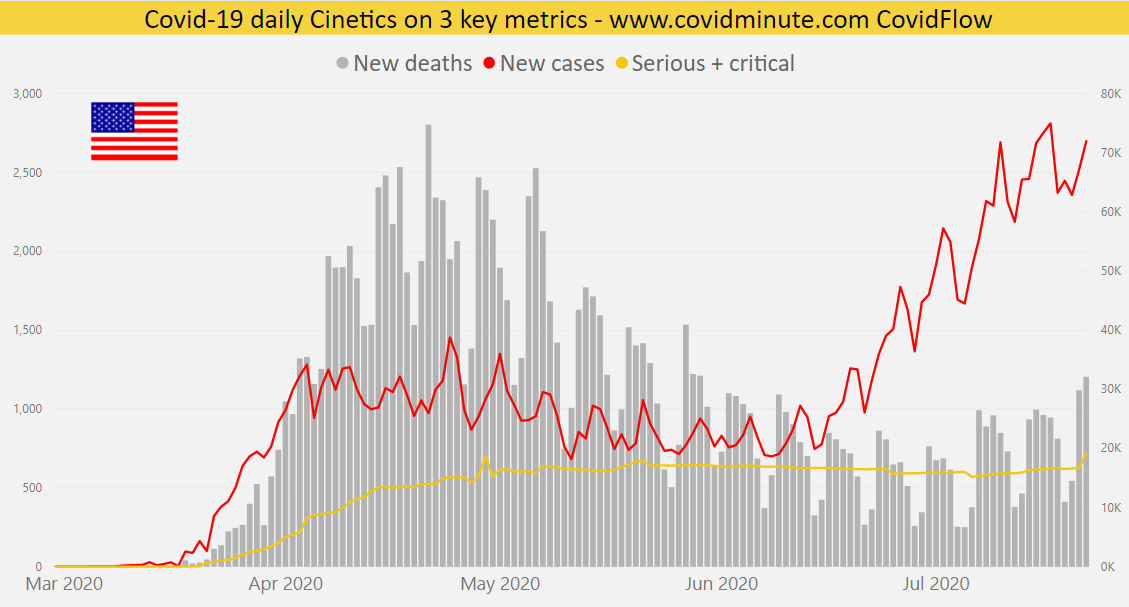
5.1 USA
2 important points:
– We’re testing more and more across the Atlantic.
– President Trump’s reversal from the health crisis, since he now encourages the wearing of masks.
With 100 days to go until the election and given, on the one hand, the record numbers observed (more than 1000 deaths yesterday), and on the other hand, its fall in popularity in the polls, the strategy of “all economy” does not make a recipe. In the absence of epidemiological control (see the number of deaths/day has started to rise again), and at the current rate (1000 deaths per day or 200k deaths at the beginning of November), its health management will not be defensible: figures equivalent to Italy, while the Continent has been hit 2 months later.
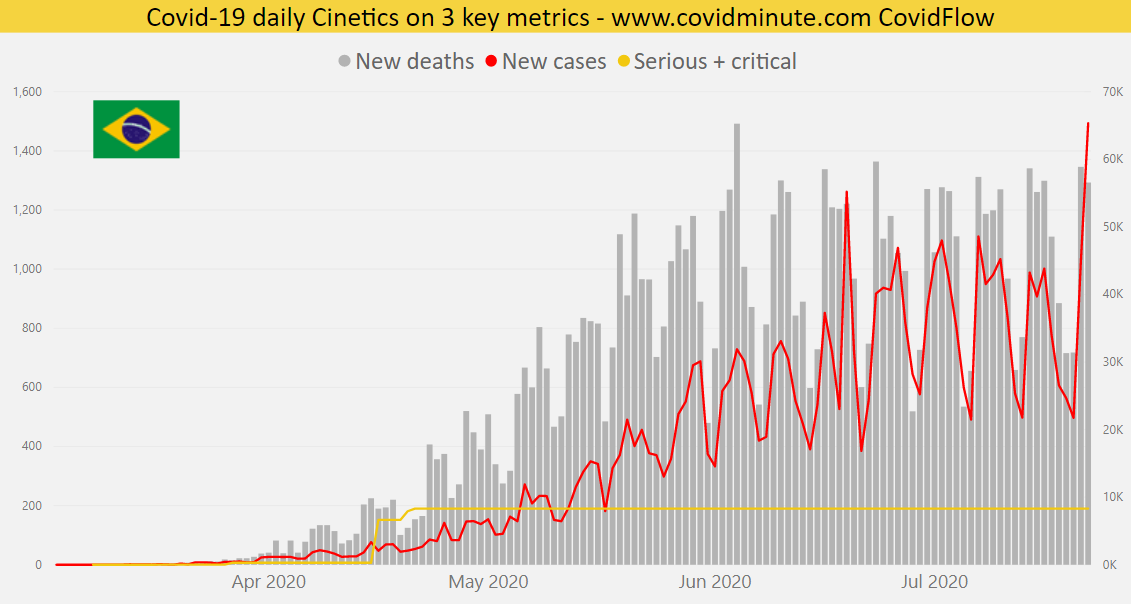
5.2 BRAZIL
5.3 INDIA

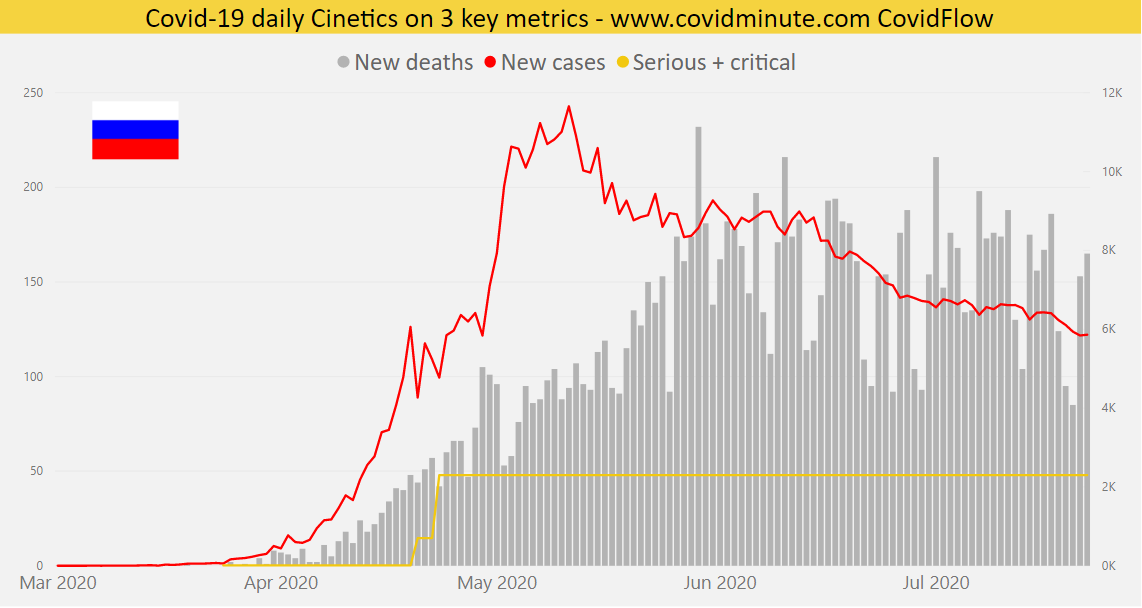
5.4 RUSSIA
5.5 SOUTH ASIA COUNTRY IS AND OCEANIA: VIGILANCE EGALEMENT
As shown, the mapping below (evolution of cumulative cases), several “countries” including Australia (partial closure of the Melbourne region for 6 weeks), Hong Kong (closure of all schools since 13/7), India or the Philippines are currently in the rebound phase … However, as all indicators are test dependent, it is necessary to remain reserved

6/ MORTALITE 80% of cases (and deaths) in the West.
6.1 General data:
Of the 600 k deaths observed to date, roughly 200k deaths in Europe, 150k in Latin America (Brazil: 80k, Mexico: 40k), 140k in the USA, or 82% (490/600k) of deaths in the West.
6.2 Space-time Evolution: an evolution to understand restraint measures in the US
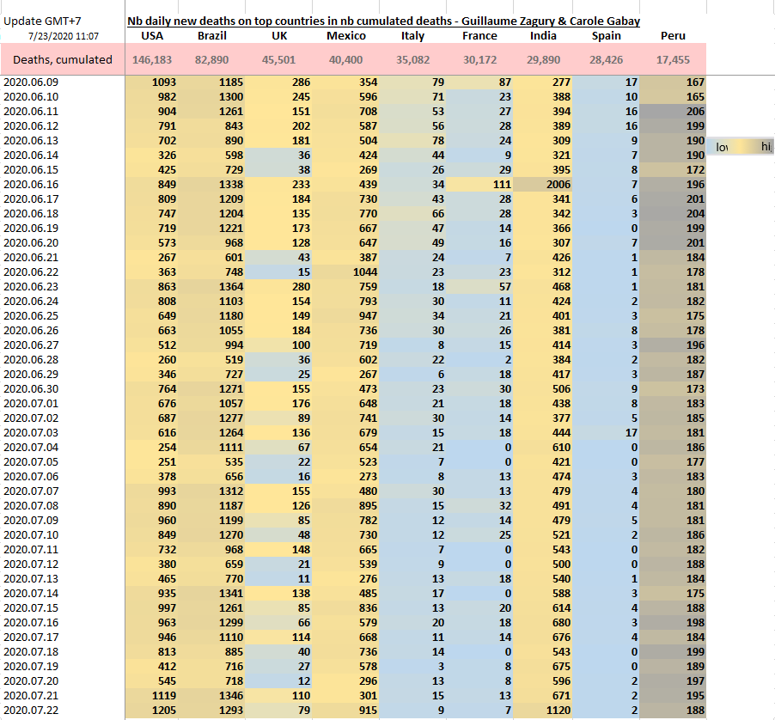
6.3 Results indicator (read without making shortcuts too fast!): Brazil and USA at the same level and … still in epidemic phase.
7/ SPACE TIME TABLES

—————————————————————————————————
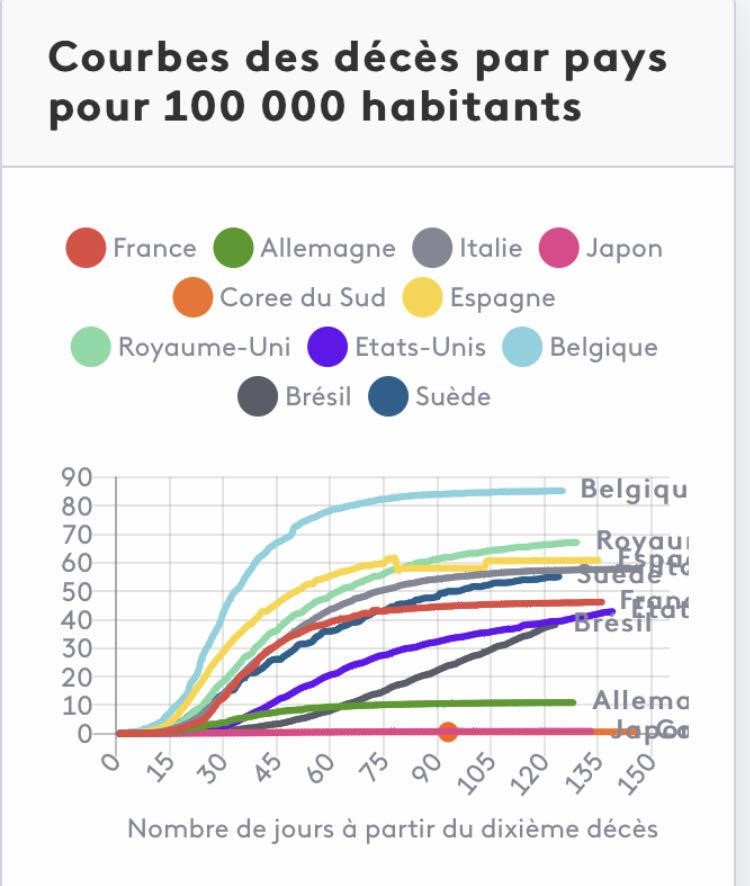
I invite you to visualize on the Covidminute website, a substantial work done with the collaboration of Carole Gabay and Alison Ray, on comparative mortality curves in France (space, time, age…)
All the necessary data is available on: : www.covidminute.com, as well as the entire iconographic database and the Covidflow tool (any information by country or state).
As always since January 28, the trilogy: 😷 🤚 ↔️
Have a good week,
Dr Guillaume Zagury
No: If you would like to join our team: guillaumez888@hotmail.com
See you next week (1 scan per week)
Note that you can:
• download the visuals developed since the beginning of the adventure www.covidminute.com on https://covidminute.com/visuels-memos
• consult all the graphs / analyzes, updated with each article publication https://covidminute.com/les-dossiers-thematiques – France and China documents are updated every day except weekends for France, which has not published Covid data on weekends and public holidays since the end of June.
• browse the CovidFLow tool which continues to be updated daily for more than 200 countries and 50 states of the USA: https://covidminute.com/covid-flow