________________________________________
In the information overload (of which we are a part!) Of the “information superhighways” it is very difficult to detect the 5-6 “strong signals” of the surrounding “noise”.
From Monday, we will offer you daily, from 8 am, a readable tool (new visuals) in less than 6 minutes, in order to understand the global evolution of the Covid, as well as its challenges (“Geopathology”).
“All success is collective”, and I want to involve the entire Medical team (of course, Dr Bachir Athmani, an accomplice for 20 years, Dr Mohamed Fadel, Dr Denis Boutry, etc.), the “Datas Analysis” team ( Carole Gabay in the lead, Laetitia Bernard-Granger,…), the IT team (Richard Coffre our excellent webmaster, the Management team (Flavien Palero,…), and all the contributors.
Without forgetting our generous donors (Benjamin D, Sabrina R…) and of course the Paul Bennetot Foundation / Matmut Group.
Also, if you wish to become a personal partner (geographic or technical competence or other …), or institutional (so that we can acquire “mapping” tools for example), do not hesitate to contact me: guillaumez888 @ hotmail .com
For those who would be interested in a content supply partnership (Academics, Media, Companies, etc.), know that we have created databases since 01/28, with data (medical, public health strategies, etc.), which you cannot find nowhere else.
The CovidMinute team has been offering analyzes on Covid19 since January 28. Your support is essential to continue to maintain our team. Thank you for your participation.
Support us
—- MINUTE ANALYSIS —-
A / WORLD DYNAMICS: “THE MORE WE TEST, THE MORE C + WE HAVE”
A.1 CHRONOLOGICAL ASPECT: Stabilization of reported cases
Dependent test => nearly 250 k / day with “historical” peak on 9/13 at 308k), and declared mortality always at +/- 5 k deaths per day (5990 yesterday) …
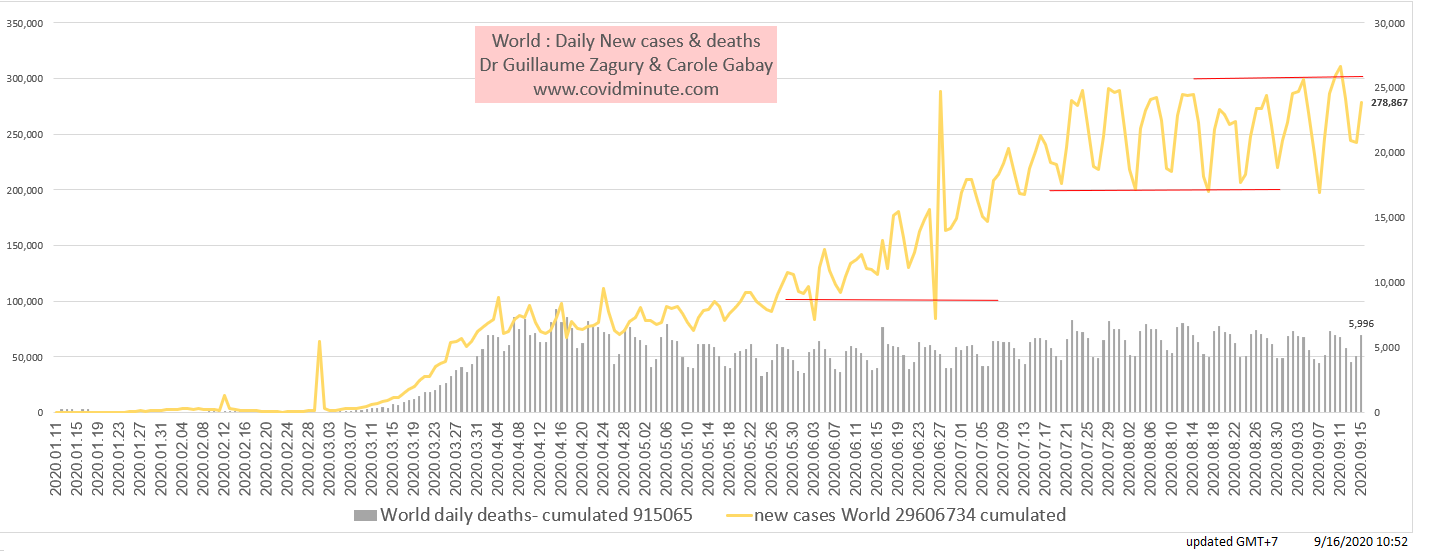
Of course, all the “dependent test” indicators should be interpreted with the greatest caution (availability of tests, sampling technique, positivity threshold, positive and negative predictive values, etc.), and thus be integrated in addition to other elements leading to positive diagnosis (risky contact, suggestive clinical symptoms, specific imaging / CT Scan, etc.).
A.2 GEOGRAPHICAL ASPECT: CHINA ALWAYS IN ITS OBJECTIVE C (-) FOR 6 MONTHS!
More than 100 “Wuhan” in the World, and let us note that Mainland China is the space which is the most spared in the World. I invite you to read the article published in Liberation, last Saturday, allowing to understand this discrepancy (of course, some media wonder, and rightly about the reality of the figures, but being there I think they correspond to reality !).
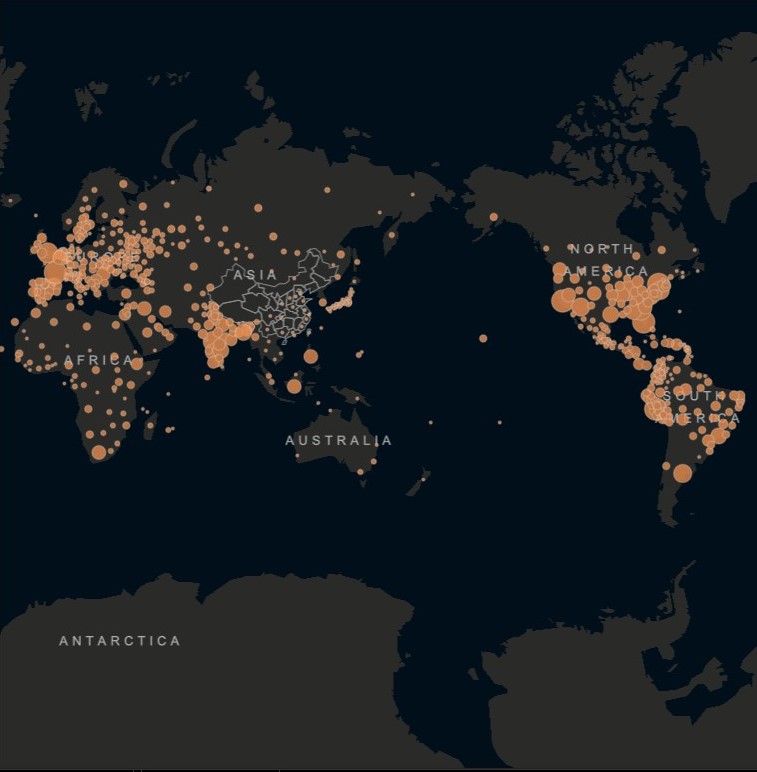
Source John Hopkins University.
A.3 CHRONOLOGICAL ASPECT –
A.3.1 WORLDWIDE INCIDENCE – INDIA IN THE EPIDEMIC PHASE (1000+ deaths / day for more than 10 days) & THE AMERICAS IN SLIGHT RECOVERY
As foreseen for 3 weeks, India is in epidemic phase (under declaration ++, but fortunately a “young” country & consequently to our knowledge: “The resuscitations are not full”).
A.3.2 INCIDENCE -TOP 10 COUNTRIES: THE INDIAN SUB CONTINENT IN EPIDEMIC PHASE & THE AMERICAS STILL FOR MORE THAN 50% OF DECLARED C + (& MORTALITY)

A.4 / C + WORLD PREVALENCE:
USA (38% of C + declared) & INDIA (12% of C +) & BRAZIL (10% of C +) POSSIBLY IN “POST PEAK”
(C +, ICU, DEATH)
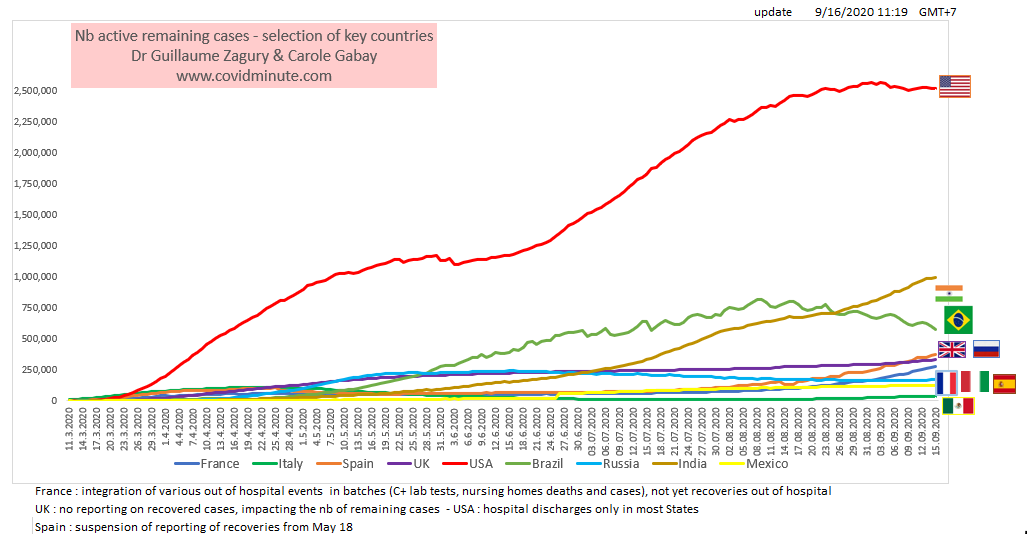
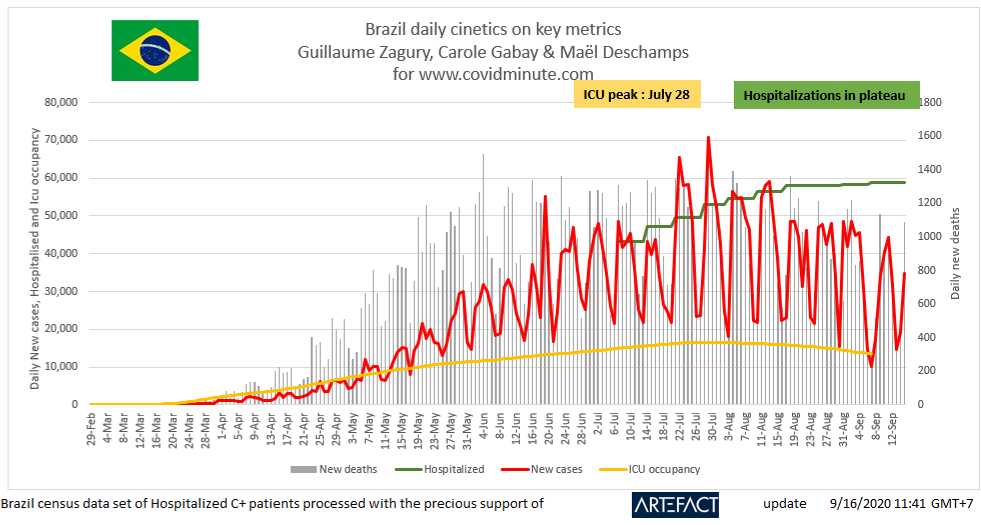
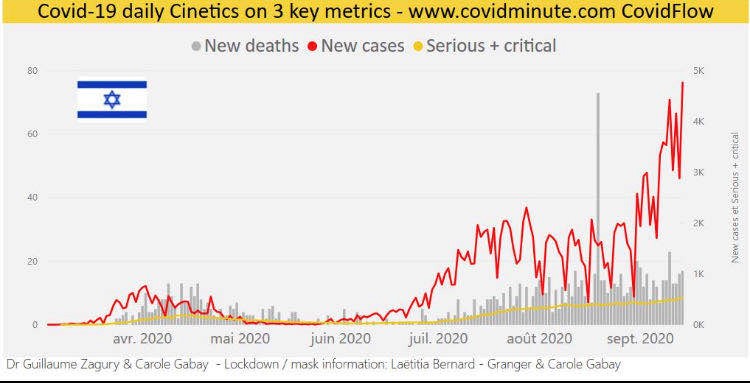
A.5 / WORLD BAROMETER – COUNTRY FOCUS: USA, BRAZIL, INDIA, ISRAEL.
Attention, the vision of the epidemic that with a “test” indicator is extremely questionable (+++), and therefore I invite you to see the “country” figures using the 3 indicators having the most meaning: Hospitalization (when available!) – ICU (when available!) – Death
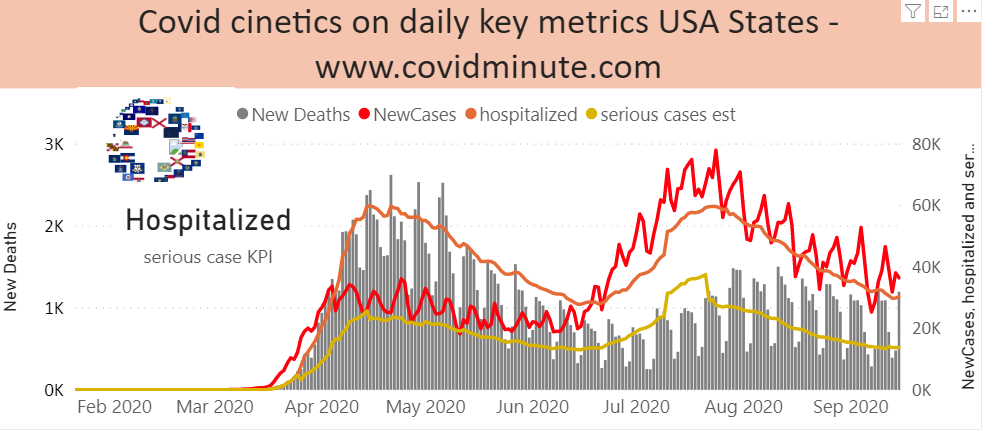
A.5.1 USA on D 49 of the elections: FAVORABLE HEALTH TREND BUT VIGILANCE
(1200 deaths yesterday… but we know they represent the situation at S-2)… to be continued
A.5.2 BRAZIL: Brazil on a rather favorable plateau
A.5.3 INDIA: IN THE EPIDEMIC PHASE (SHORT-TERM FOLLOW-UP BENGLADESH & PAKISTAN)
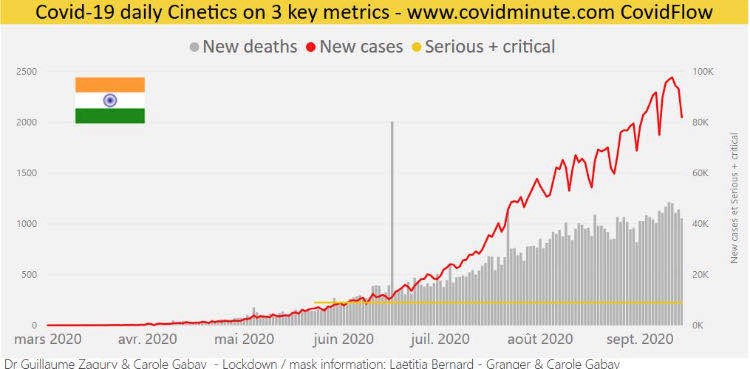
Obviously, a continent country with underreporting (and difficulty in aggregating data), but the country’s youth, hopefully a good omen, for this continent country (1.4 billion inhabitants).
A.5.4 ISRAEL: CORONAVIRUS DOES NOT MELT IN THE SUN!
3 times more deaths in summer than in spring … re-containment for 3 weeks.
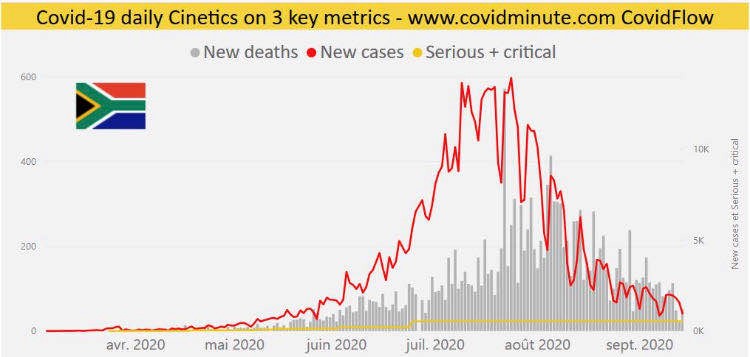
A.5.5 SOUTH AFRICA: BUT… IT’S NOT SO SURE!
For this potential temperature effect (direct or indirect impact), I invite you to see my interview in Liberation last Saturday.
A.6 / GLOBAL IMPACT: DEATH ANALYSIS
To date 80% of deaths concern westerners, generally city dwellers over 60 years old
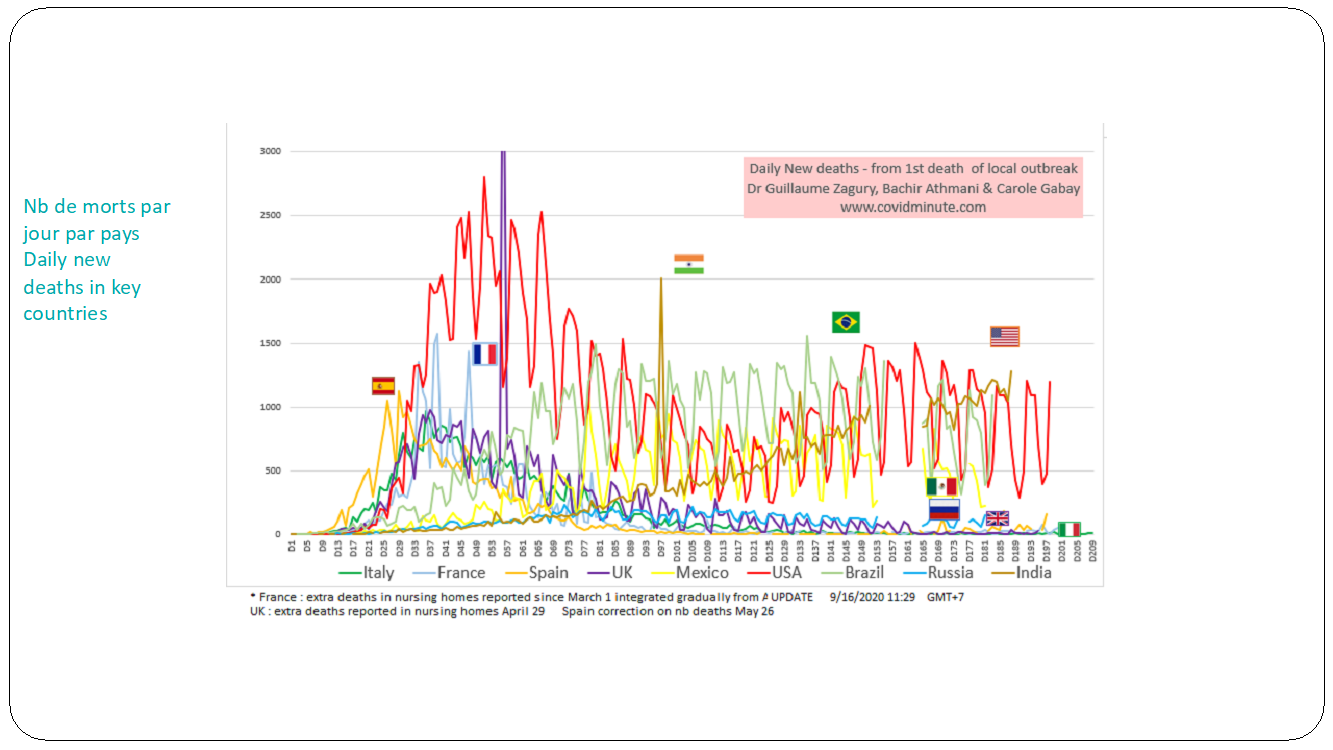
A.6.1 TOP 10 COUNTRIES: Chronological evolution of daily deaths by country:
The Americas above all (3 first countries affected and India in active phase)
A.6.2 RESULTS INDICATOR: Watch out for shortcuts…
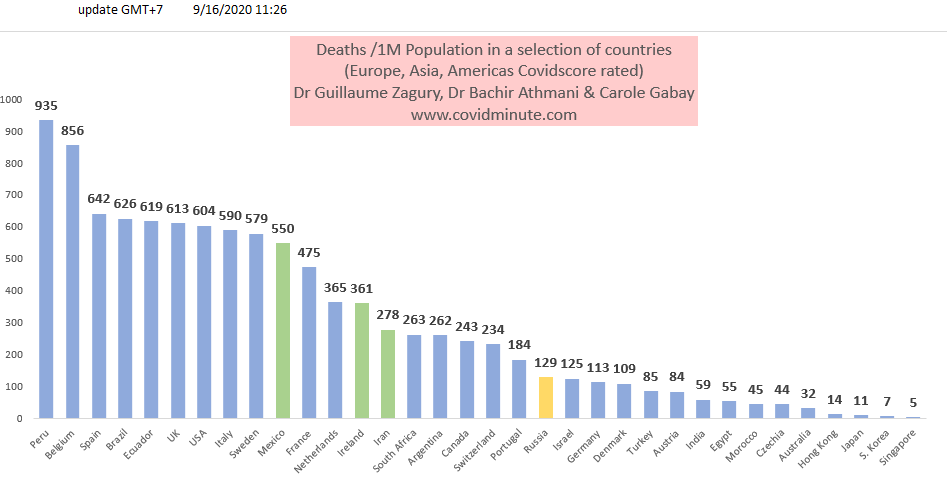
This indicator is interesting if we compare “apples with apples”, which means, “homogeneous” definition of the numerator (“Covid death”), of the denominator, and interpretation taking into account country specificities (Ephad…).
B / EUROPE: EPIDEMIC RECOVERY BUT NO 2ND WAVE
B.1 GRAPHIC VISION: RELATIVELY POSITIVE situation
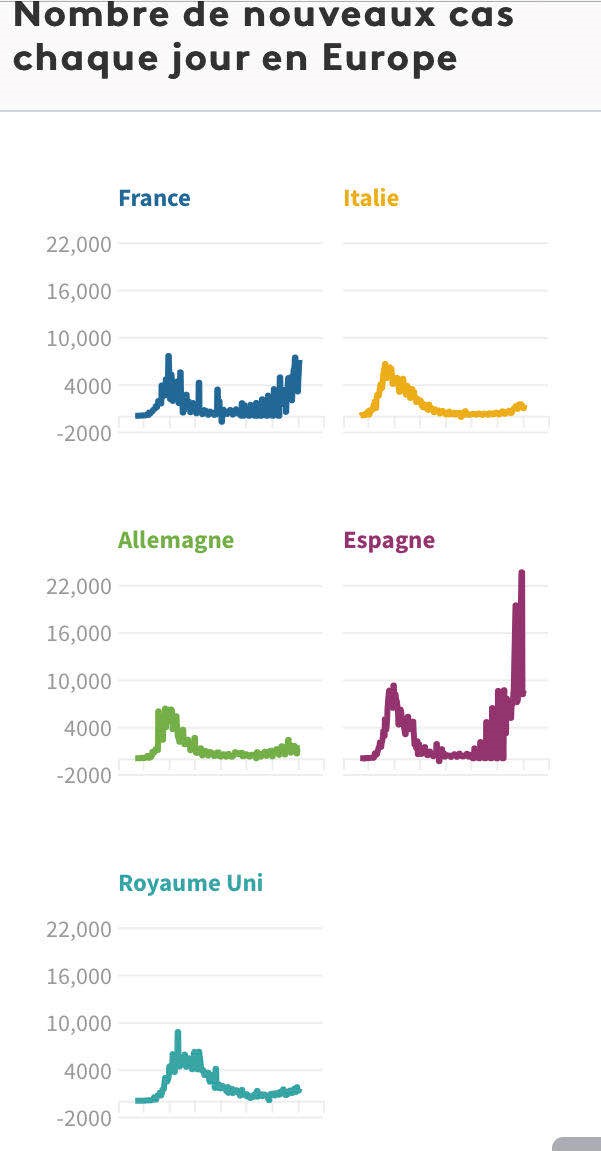
B / DETAILED VISION -A VARIABLE GEOMETRY, AT NATIONAL LEVEL: France and Spain far behind Germany and Italy
I offer you a very detailed vision (evolution with variable geometry in time and space), provided by our team (with Carole Gabay expert in Data Analysis) on www.covidminute.com
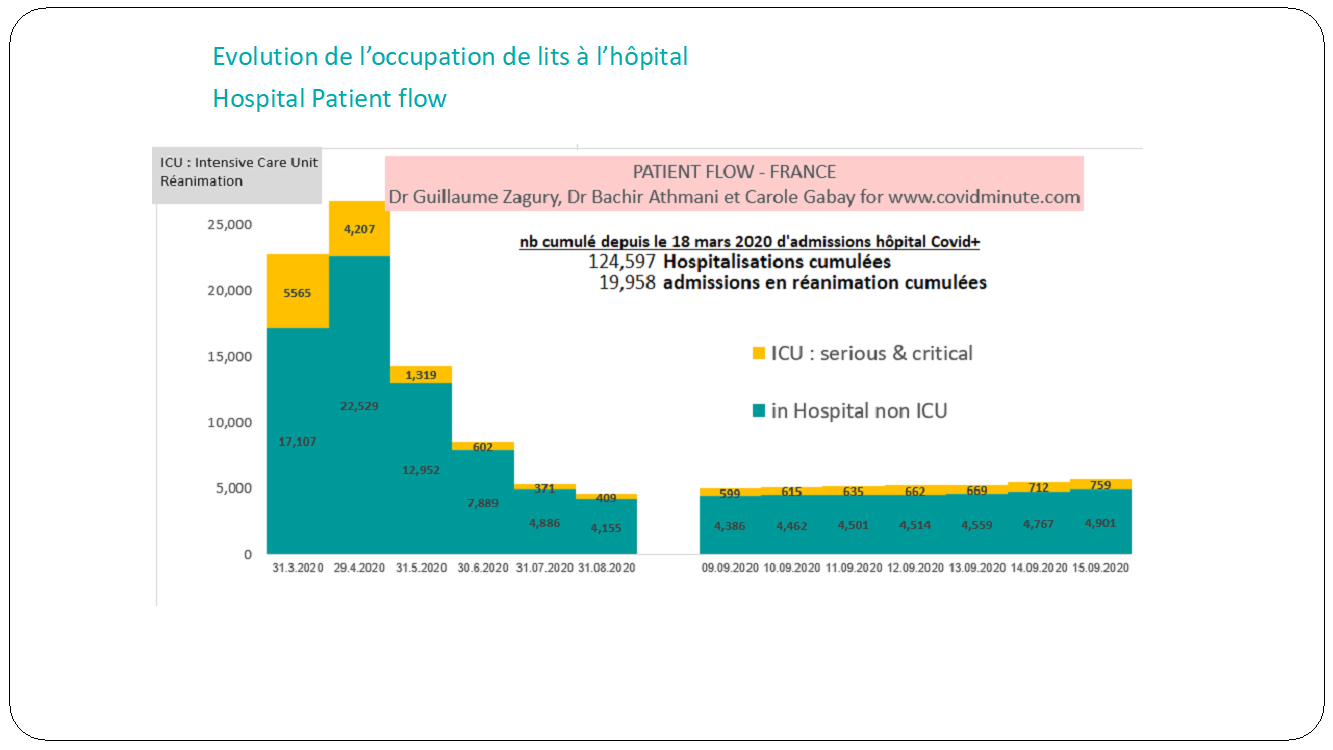
C / FRANCE: “LIVE WITH & CITIZEN ATTITUDE”:
C.1 / The parents of the young C (+) of today, can be hospitalized tomorrow….
As in economics, there are a large number of indicators (Hospitalizations, ICU cases, Deaths, test positivity rate, C + incidence, R0 index, SOS C + calls,) which most often come together to identify a trend. No indicator is perfect, and each measures part of the problem. I particularly recommend the first 4, which reflect an indisputable “field” medical reality and the speed of circulation of the virus.
However, knowing that we can make numbers say a lot of things, when they are not relativized in time, and in space …
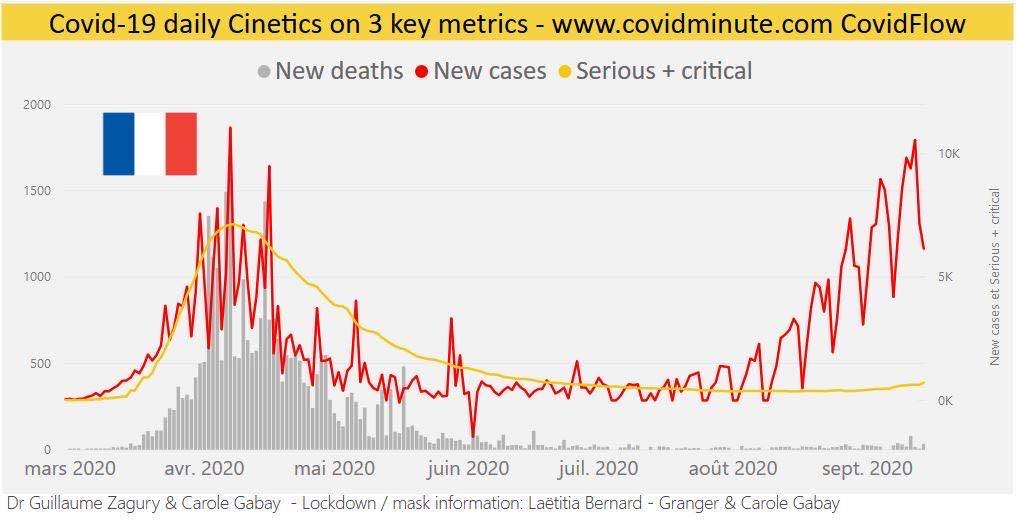
C.2 THE SITUATION CANNOT BE COMPARED TO APRIL:
• C + hospitalizations (with ICU): 4901 (versus 4767 last week), ie roughly 5 times less than C + / April.
• ICU: 759 (712-the previous week) versus 5500 in April
• Deaths: 49 (38 last week) versus figures between 500 and 1000 / day in April.
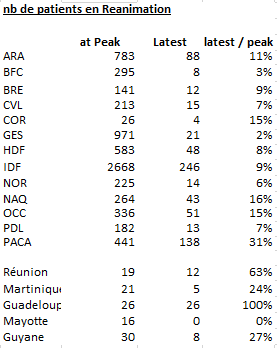
C.3 We must reason at the LOCAL level: “REGION BAROMETER”
But do not be naive and do not let the “embers become fire” maintain individual vigilance (“3M”)

Dimensional equation, knowing that the C + -H + -ICU-DC kinetics usually take place over a period of about 2-3 weeks. This helps us understand decisions better
Taken according to geographic dynamics.
For those who want a maximum of information, I invite you to consult
www.covidminute.com and the very complete tables provided by Carole Gabay and our team.
At the “micro” level, it is extremely difficult to establish clear actions of Public Health without being in a certain way liberticidal (see mask, test, isolation,) and the level of security varies according to the viral spread. As this magnificent pharmaceutical observation says: “Between the drug and the poison, it is only a question of dosage”. Thus, everyone must be responsible and adapt a citizen attitude of “mobile confinement” (= mask) and intelligent (= perception of a “risky situation”: not to become a health extremist, if alone in your car or at the office !)….
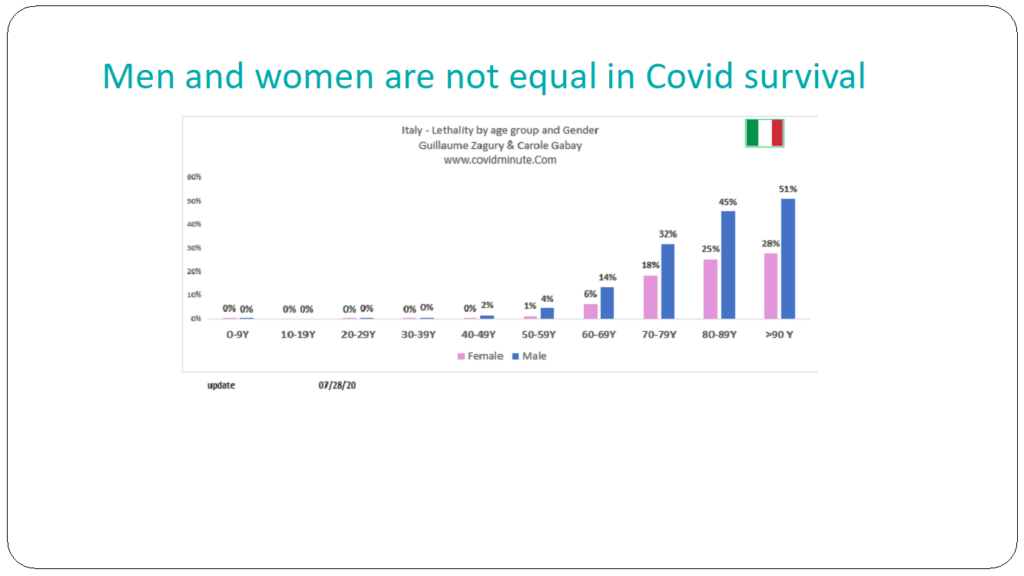
D / EPIDEMIOLOGY: MEN MORE FRAGILE THAN WOMEN (Comorbidity? Genetics?)
E / GEOPATHOLOGY (section created in February!) – VACCINE: ALL VACCINES LEAD TO MAN (continued)!
I invite you to read the article on Liberation last Saturday and know that 9 vaccines have been in phase 3 since September 9 (and 140 in development).
-As a specialist friend says: “The vaccine may have no borders, but researchers have a nationality”, and you will find a specialist “update” every week, in our new version starting on Monday next.
F / TO GO FURTHER:
• download the visuals developed since the start of the adventure www.covidminute.com on https://covidminute.com/visuels-memos
• consult all the graphs / analyzes, updated with each article publication https://covidminute.com/les-dossiers-thematiques – The documents for France and China are updated according to the frequency of updating day of sources.
• browse the CovidFLow tool which continues to be updated daily for more than 200 countries and 50 US states: https://covidminute.com/covid-flow
So that we can continue to innovate, you can support us directly
————————————————————————–
Thank you again for your trust.
As since February:
-The “3M”: for 70% of the population at very moderate risk
& I added Minute = limit prolonged contact: “4 M” for the 20% of French people over 65, the 10% of people at risk (roughly: cf. Long-term conditions) and the +/- 2 million caregivers particularly exposed….
Dr Guillaume ZAGURY,
Practitioner,
Specialist in International Public Health and Medical Innovations
HEC
In China since 2000.
guillaumez888@hotmail.com
________________________________________