With covidminute.com, live from Shanghai
The news catches up with us, and I was asked, by readers in France and China, to try to “give meaning” to the “Covid” information.
🇫🇷 France : dashboard
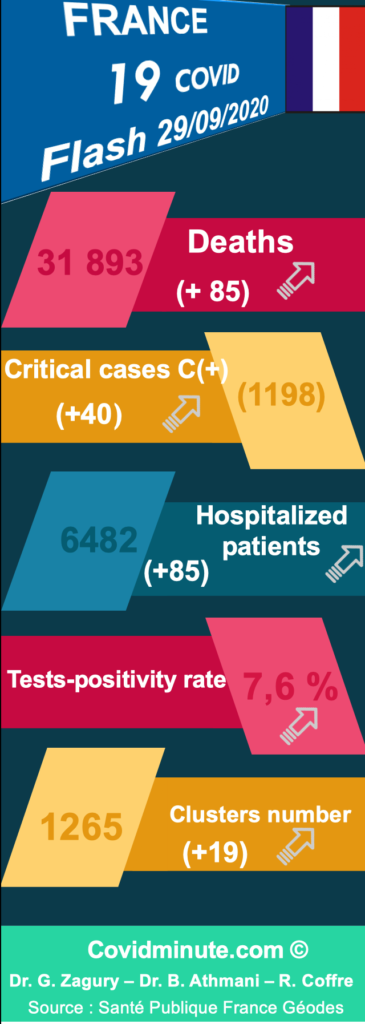
Equation to dimensions: have in mind the “maximum figures” observed during the April peak:
- Hospitalizations (+4281) / Versus +698 today
- Intensive care (+771) / Versus +165 today
- Death (+ 605 at the Hospital) / Versus +85 today
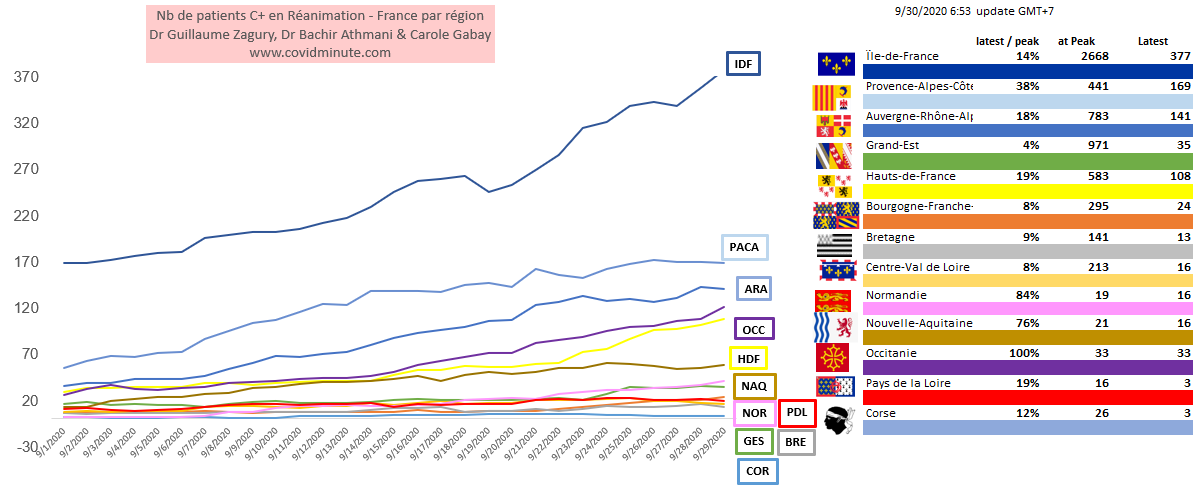
🇫🇷 France : local gestion
The virus circulates in France and in the DOM, and an epidemic phase is observed according to the regions (IDF, North, …)

Source : Santé Publique France
To understand the situation in France, you have to know how to reason about the issue = intensive care beds, in terms of load / capacity.
On a national level:
Resuscitations are filling up: + 800 cases C + this last week (for a maximum current capacity of 5000 beds C + & C-).
The figure below only shows the evolution of C +, and the room for maneuver before “pushing the walls” and considering possible sorting is reduced (see especially the possible decompensations of the flu season are coming soon).
Consequently, everything depends on the evolution, and the effectiveness of the preventive measures to “flatten as much as possible” the curve (act 2 – red), and thus to be able to “live with” (while waiting for a vaccine?).
As such, there should not be opposition, but complementarity between white coats and white shirts, to strictly enforce barrier gestures (see 300 nightclubs have already closed!)

At regional level:
To pass to the maximum alert threshold locally, 3 kinetic criteria must be met:
. the disease incidence rate (threshold of 250 C + cases / 100k inhabitants),
.. the incidence rate for the elderly (threshold at 100 C + per 100 k)
… The occupancy rate of intensive care beds by Covid patients (must not exceed 30% of its capacity).
As the figure C + & C- load / capacity, resuscitations according to the regions is difficult to obtain in real time, we have represented in this figure, the% of C + observed compared to the figures for the peak in April (7632 patients C + in intensive care), and where the number of beds had been increased. This figure already makes it possible to see the regional trend and to see the localities where the alert threshold will be reached (with its corollary of freedom-killing measures).
There are still many unknowns, and we can see that in the PACA, the system is still within acceptable thresholds. Conversely in Paris and in IDF, the system is under tension (400 hospitalizations C + and about 100 C + in intensive care).
⚠️ To go further
1/ Chronological Vision (Time)
2 & 3/ Regional Barometer & DOM TOM
🇪🇺 Europe : “Barometer per country”
A North South gradient observed
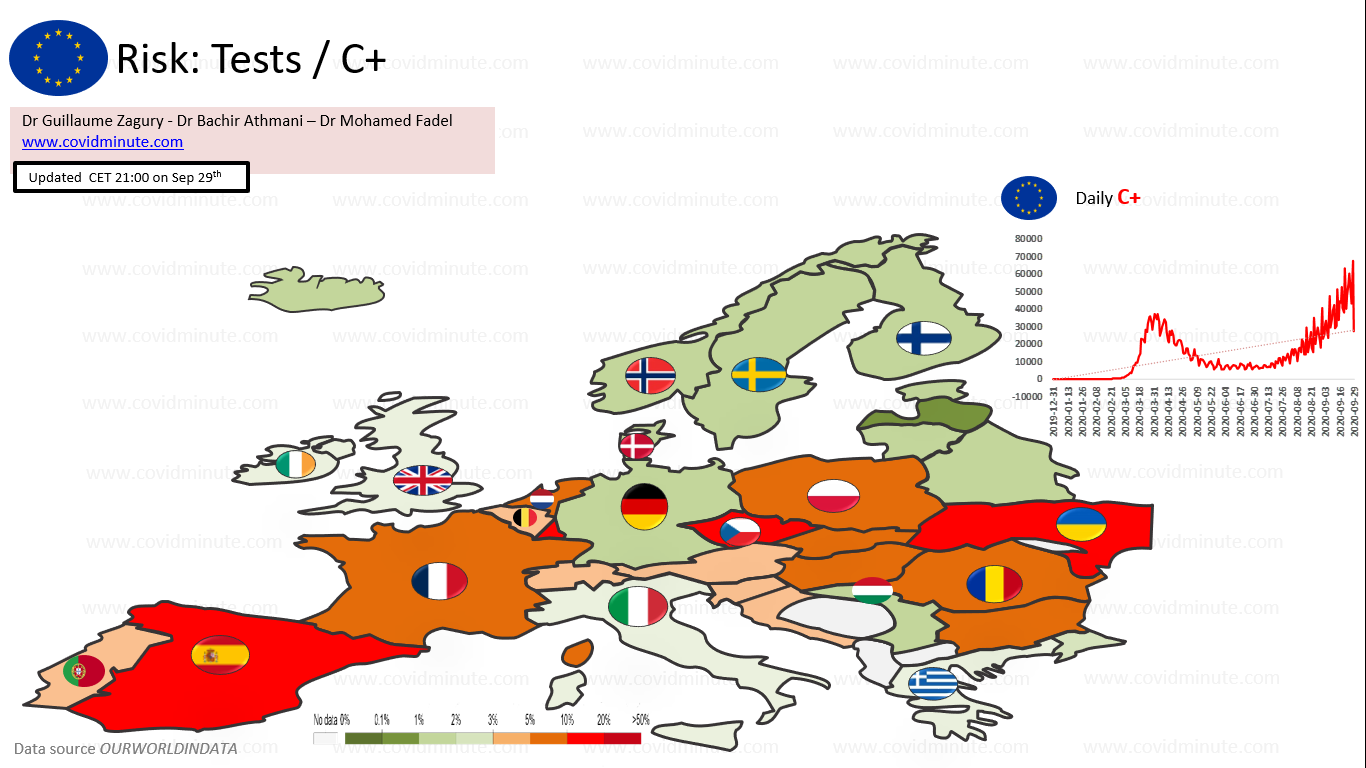
In terms of “homogeneous” comparisons, let’s not forget that we must reason at 4 levels: local (department) – regional – national – European
-8 countries are currently “sensitive” in Europe: Spain and France in the south and some countries in the East (Romania, Czech Republic, Ukraine,…), but also Belgium and Holland are to be watched
⚠️ To go further
World : “World pandemy”
Time : A 5 kinetic viral phase

Have the few key figures in mind: 5k deaths / day and +/- 300k new officially declared C + / day (beware of everything that is “test dependent” in terms of measurement and interpretation).
Good news, it seems that a slowdown is observed in terms of mortality / day.
Space: India takes over from the Americas (improving trend to be confirmed)
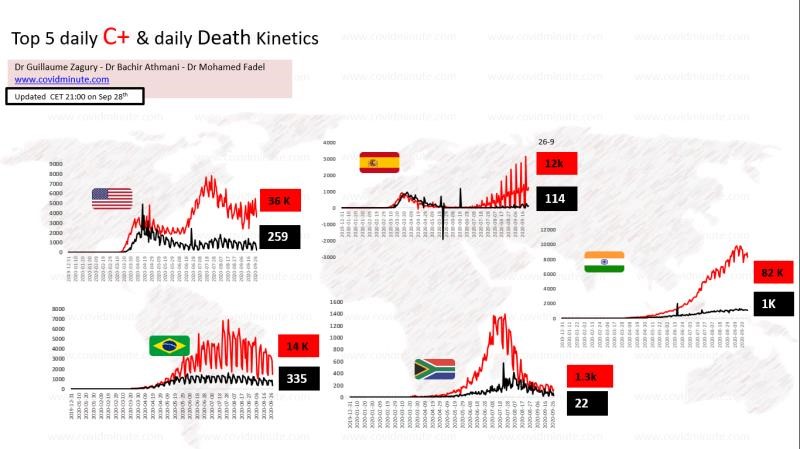
For the USA and Brazil, it seems that the situation is improving on the various parameters.
⚠️To go further:
6/ Kinetic deaths for major epidemic countries
« Out of the box » (weekly zoom)
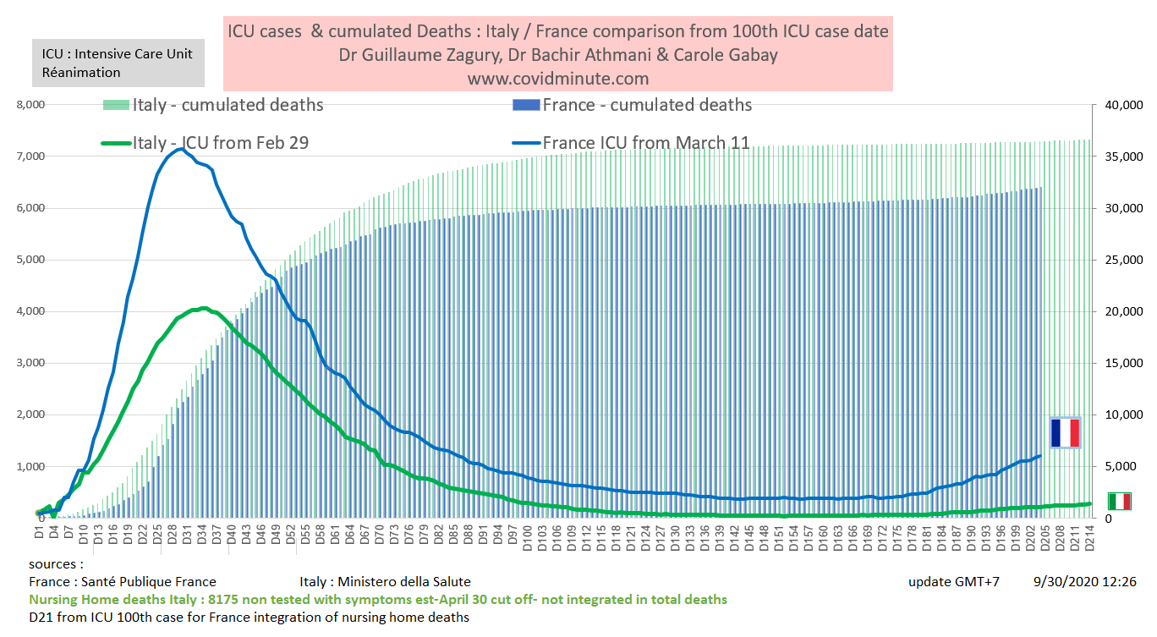
Our Transalpine friends are currently better off (one of our classic figures during the previous confinement)….

Géopathologie : « viral RNA expresses The Cultural DNA of Societies »

We stick to the news (the vaccine topic will be scheduled tomorrow!)
From today’s US debate, a sentence to ponder: “We can`t fix the economy, until the Covid crisis is fixed” (VP- Joe Biden). No one can yet say with certainty whether this will be done over a period of 6 months or even a few years.

To go further: find all the charts and tables https://covidminute.com/les-dossiers-thematiques and in Covid Flow in the Resources section every day.
In the age of the “information highways”, relayed by social networks, our goal is thus to “return to the fundamentals”: to bring out daily 5-6 “strong signals”, factual rather than emotional, in the “noise” surrounding, and thus reassure the greatest number, in the face of a pandemic always evolutionary.
« All success is collective and so thank you to our teams (Dr. Bachir Athmani, Carole Gabay, Richard Coffre,…), as well as to our patrons, and of course to the Paul Benetot Foundation/Matmut Group.
– To follow…
Protect the most vulnerable with a “citizen” attitude
- 3M for the general population (70%)
- 4M for at-risk and most at-risk populations (30%)
See you tomorrow
Dr Guillaume Zagury
International Public Health Specialist
HEC
In China for 20 years