
If in terms of these cumulative deds, the figures “converge” (helas one million deces for C-by the end of the year – all things being equal by the way), these two infectious pathologies are contrasted at different levels: typical patient (young for HIV/age for C-), clinical evolution (most often not symptomatic for C- whereas major opportunistic pathologies for aids declared cases), geographic distribution (West in majority for C/Africa mainly for Hiv), prognosis (“grosso modo” 98% of guerison for a C, very pejorative in the years 80-2000 for Hiv), therapeutic (very likely vaccine for C, no vaccine for 40 years for Hiv), Mortalite (C and HIV evolve in opposite directions in terms of APVP potential years of life lost)
——————-
« All success is collective and I would like to involve the entire Medical team (of course Dr. Bachir Athmani, accomplice for 20 years, Dr. Mohamed Fadel, Dr. Marc Abecassis,….), the Datas Analysis team (Carole Gabay in head, Laetitia Grangier,…), the IT team (Richard Coffre our excellent webmaster, Flavien Palero,…).
The CovidMinute team has been offering analyzes on Covid19 since January 28. Your support is essential to continue to maintain our team. Thank you for your support.
Also, if you want to become a personal partner (geographic or technical or other,….), or institutional (so that we can acquire mapping tools for example), do not hesitate to contact me: guillaumez888@hotmail.com
For those who would be interested in a content delivery partnership (Academics, Media, Societies,…), know that we have been building BDDs since 28/1, with data (medical, public health strategies,…), which you will not find anywhere else.
“””””””ANALYSIs” MINUTE ———————
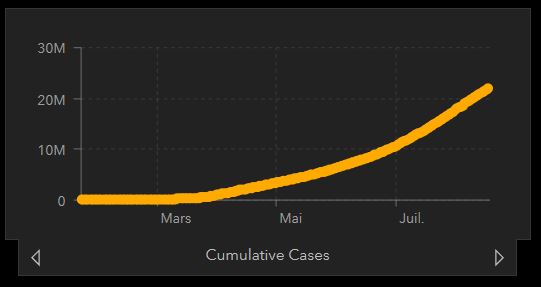
A/ DYNAMIC WORLD: 22 M DE CASES REPORTED SINCE JANUARY AND AROUND 300K / DAY CURRENTLY (TEST DEPENDANTS SO KNOW HOW TO PUT IT INTO PERSPECTIVE!)
A.1ASPECT CHRONOLOGICAL: Increase in reported cases (over 300k/r), but with a stable declared mortality (O.K.), a .5k daytime (6,311 yesterday and 6,377 last week).
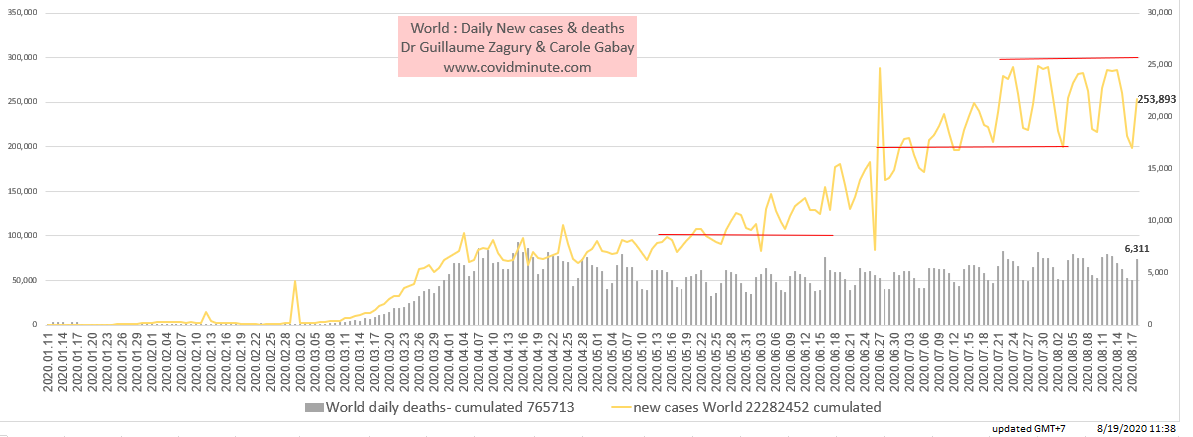
– Note 3 points:
The observed “saw-tooth” aspect of mortality, with weekly recurrence, which must probably be explained by a less diligent declaration/reporting process the WE …
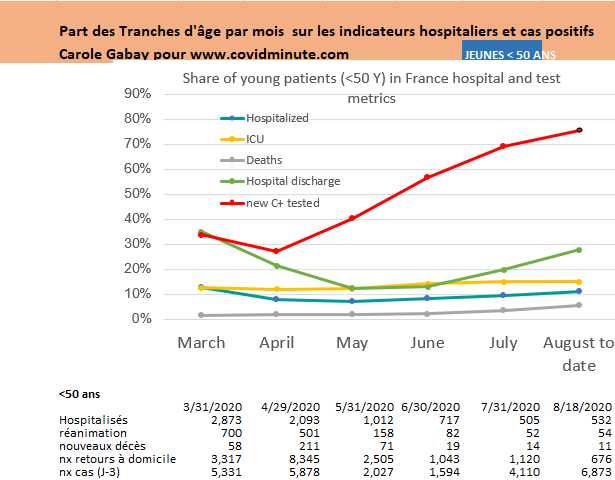
Preventive dynamics: because we are testing more and more , and more and more young (remember that in France, we only tested the hospitalized Cs during April …!)
This explains why 50% of the 22M reported cases to date have been observed 1 month ago
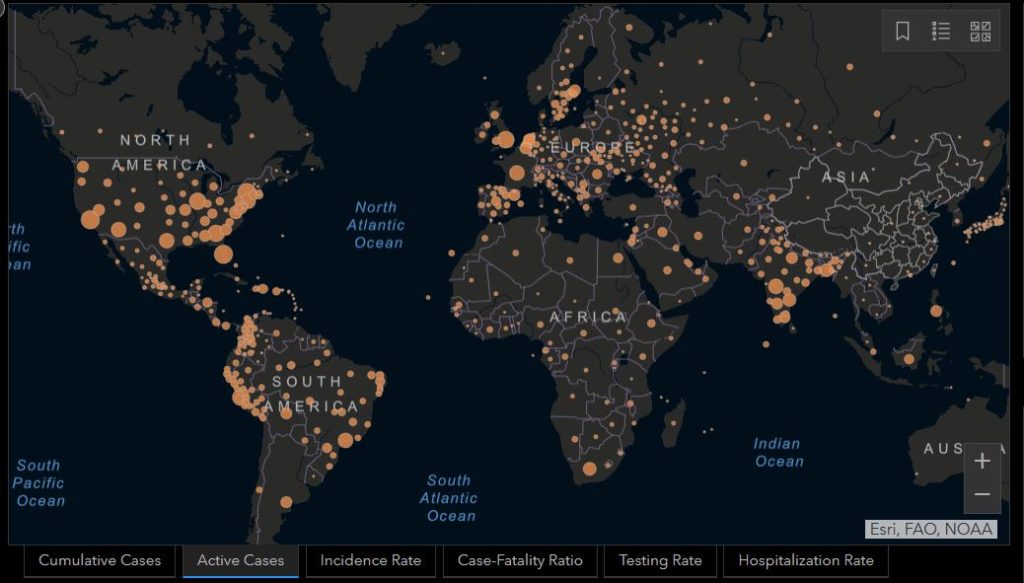
A.2 GEOGRAPHICAL ASPECT:
– More than 100 “Wuhan” in the world, and note that Mainland China is the most saving space in the world,….,and for good reason: feroce restrictions on borders, adhesion and total respect for barrier gestures, technological solutions (certainly potentially liberticidal!) used to the maximum for the benefit of the Public Health
– – Note for China, 95% of users of the “Wechat” or “Alipay” Apps (versus 3.5% for the “Stop Covid”…): this allows Mainland China to persevere in its goal to remain a country almost “Covid Free” for 4 months.

Type of QR Code requires to access the enter of your work (3 colors depending on the risk level C: red-orange-green).
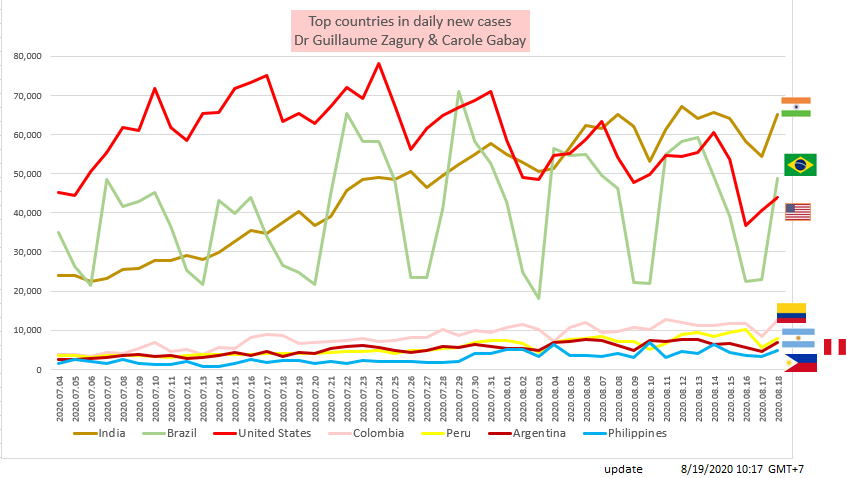
A.3 INCIDENCE WORLD – 3 Current Epicentres: As planned for the past 15 days, India is in the epidemic phase (under declaration of “young”) with always: Brazil-(Latin America) and USA (see below)
4/ PREVALENCE MONDE: AS ANNOUNCED FOR A MONTH, LET’S MONITOR THE INDIAN SUBSEENT
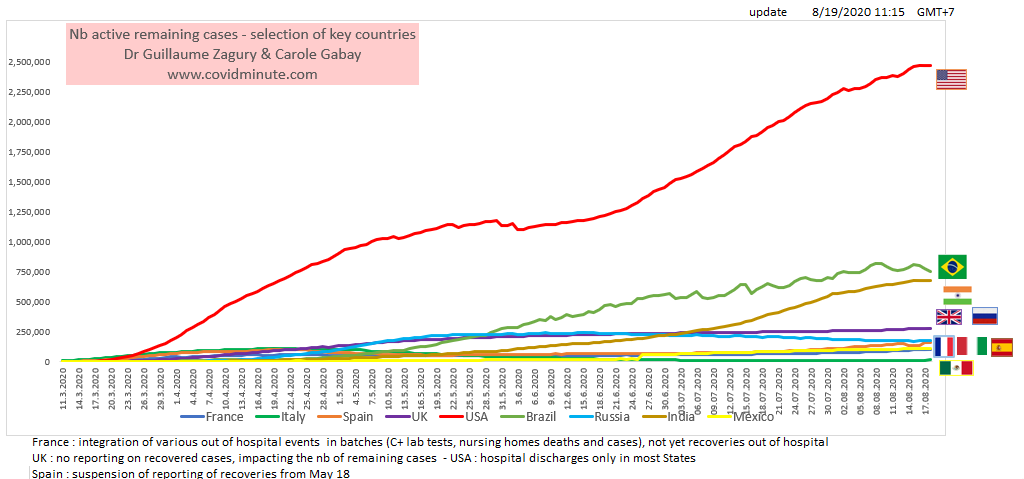
Attention, the vision of the epidemie that with a “test” indicator is extremely questionable , and as a result I invite you to see, the figures “country” using the 3 indicators having the most meaning: Hospitalization (when available!) – ICU (when available!) – Deces
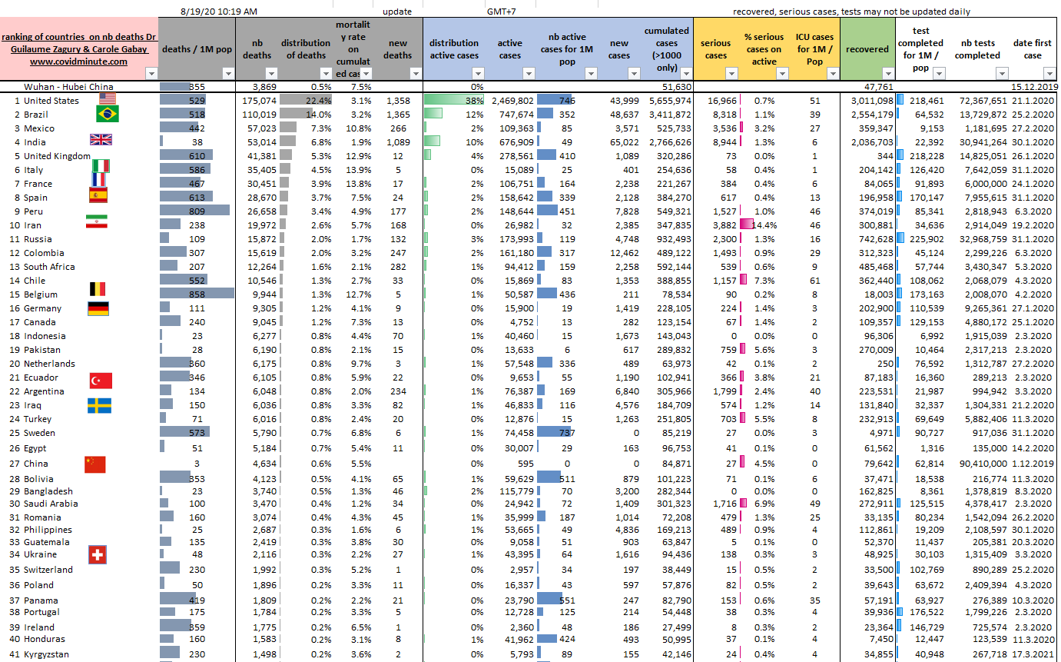
The following table produced with Carole Gabay, allows to go to the detail …
5/ AMERICAN FOCUS:
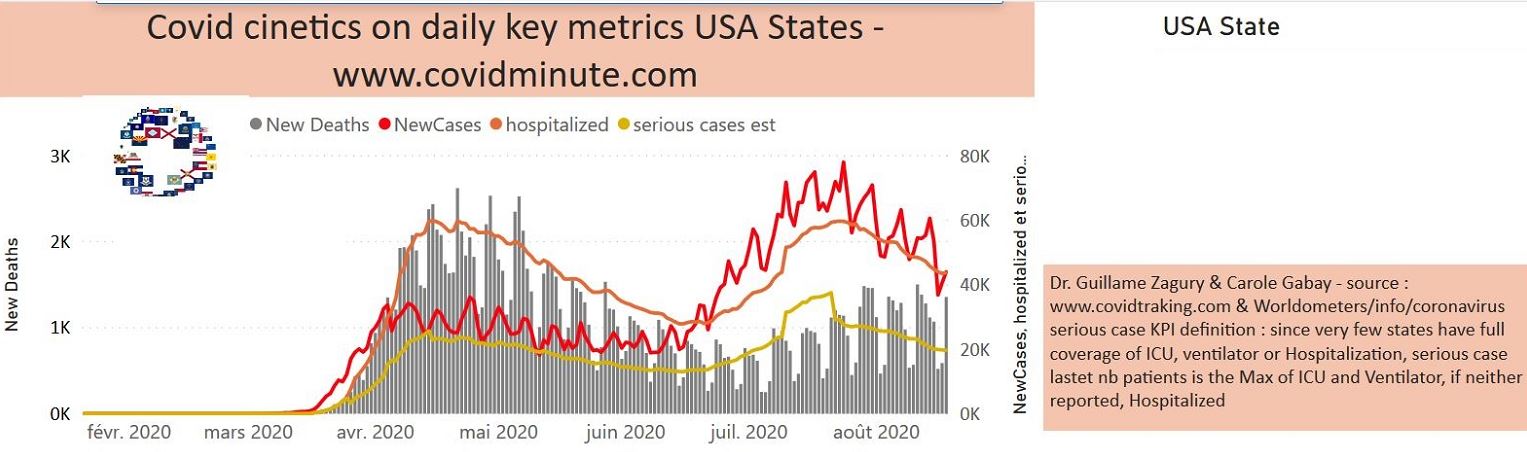
5.1 USA: NET IMPROVEMENT, BUT VIGILANCE…
5.1.1 ALWAYS A PLATEAU BUT 2 INDICATORS (H-ICU) IN DEGROWTH
5.1.2 “GEOPATHOLOGY” (topic that has been in place since January 30th!):
– As seen, two weeks ago, the American election will be played both internally (especially the 6 “Swinging States” of which 2 are still in turbulence), and outside (questioning the technological supremacy via the “vaccine race”, contested by “emerging” powers)
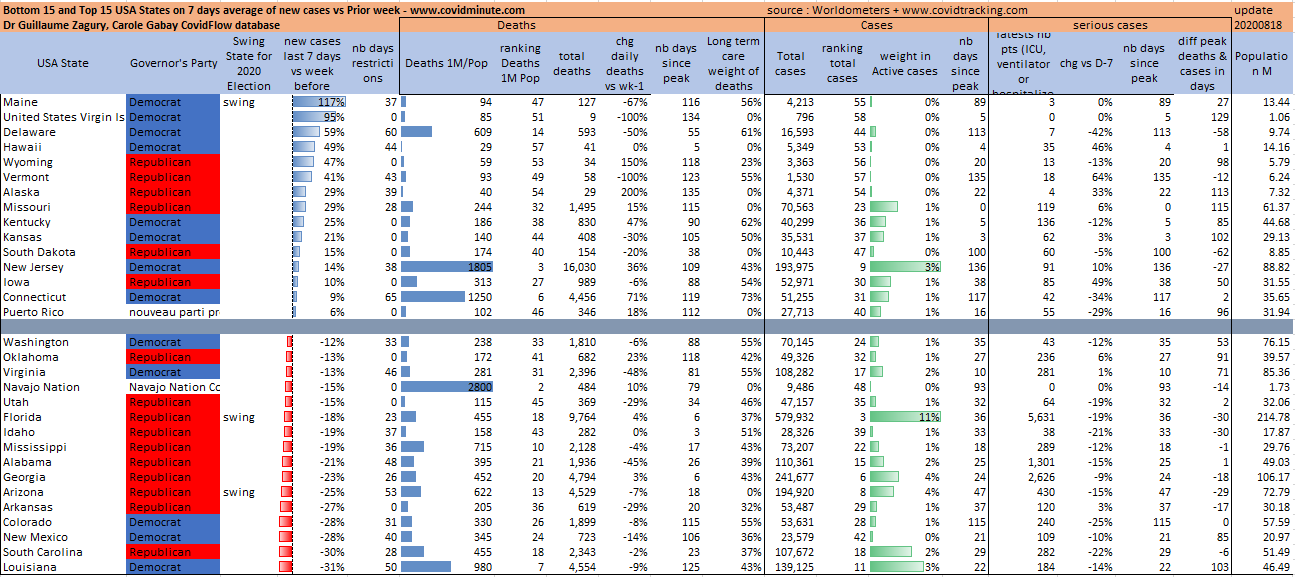
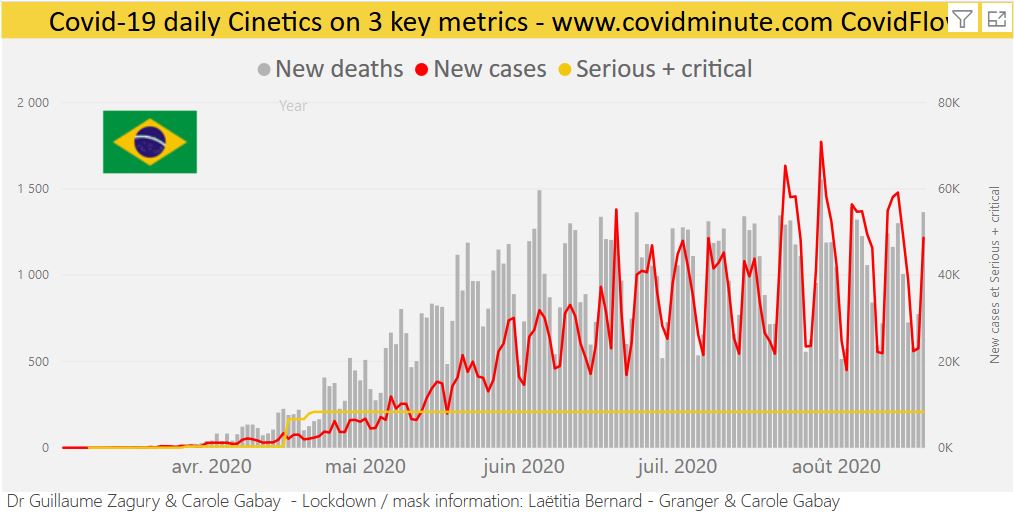
5.2 BRESIL: Brazil on set
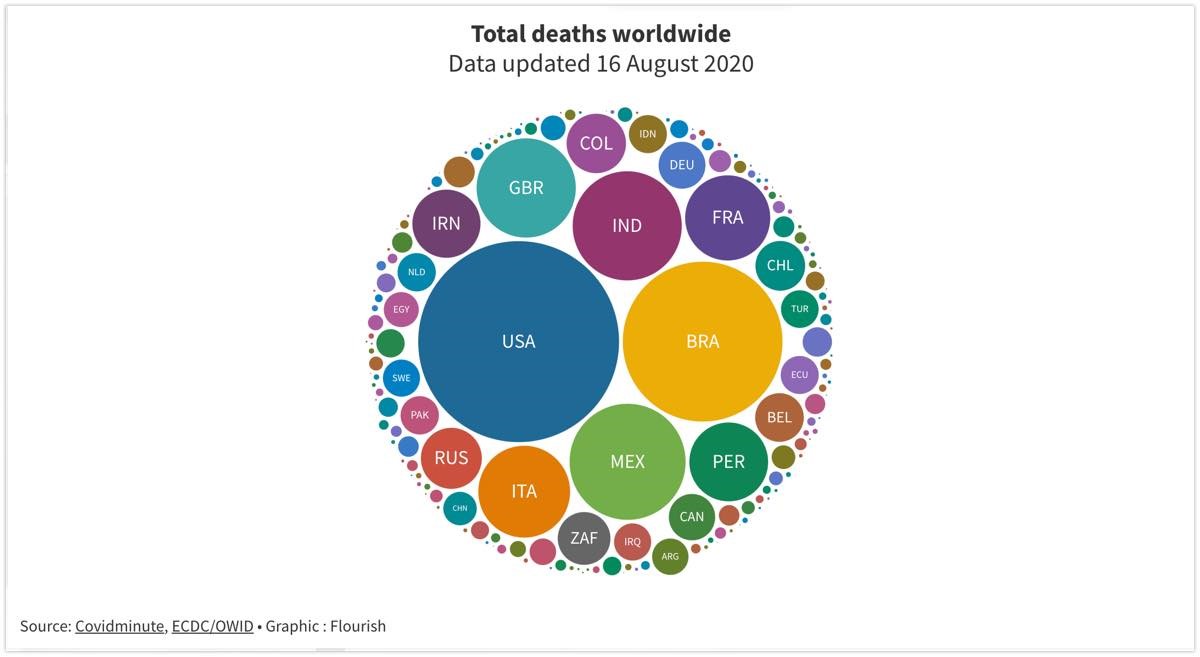
6/ GLOBAL IMPACT: ANALYSIS DECES – A M8 WE WE DIRIGEONS TO A BILAN OF TYPE HIV (1M deces/an and patients generally in full strength of age!): 725K deces to date
6.1 TOP: THE WEST FOR MORE THAN 83% OF DECES DECLARES (600K)
RESER 1 North America (USA: 160k) and Central: 225 K
2 Europe: 210K
3 South America: 160K
6.1 TOP 10 COUNTRIES:
6.2.1 Daily Deces: The USA, Brazil and India has more than 1000 deces/day
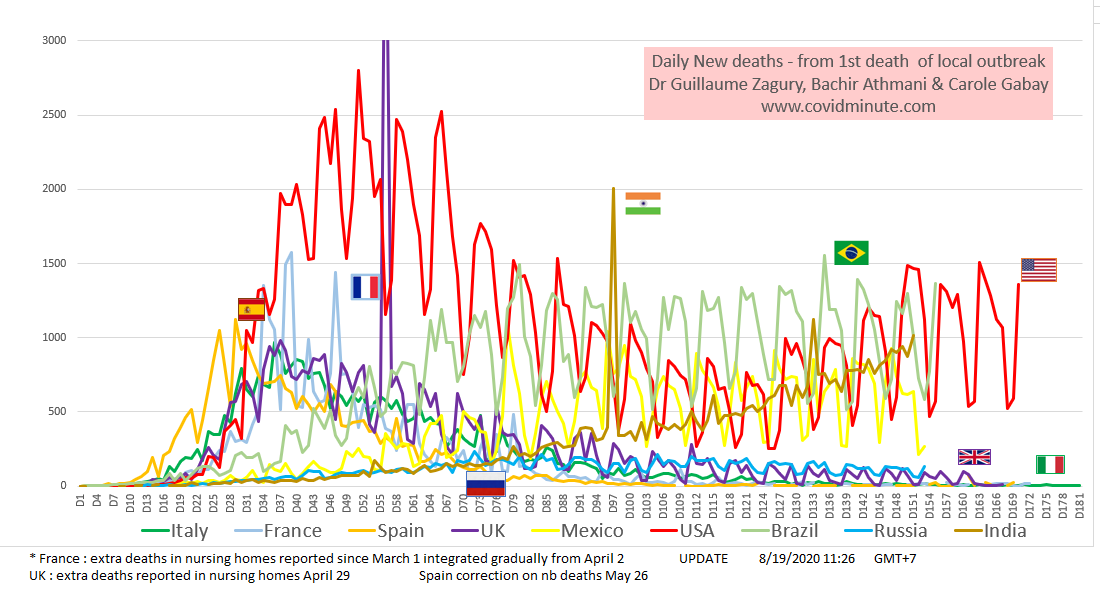
6.2.2 CUMULES DECES (83% OCCIDENT – 650k deces): AMERICA, EUROPE, and…. INDIA POTENTIALLY.
6.3 RESULTS INDICATOR: THE USA AND BRAZIL AT THE TOP OF THE TABLE AT THE HEALTH LEVEL (BEWARE OF SHORTCUTS, BECAUSE THE DECISIONS ARE MULTIPARAMETAL, AND WITH MANY WELL COMPLICATED ARBITRATIONS)

————————–B/ EUROPE and FRANCE
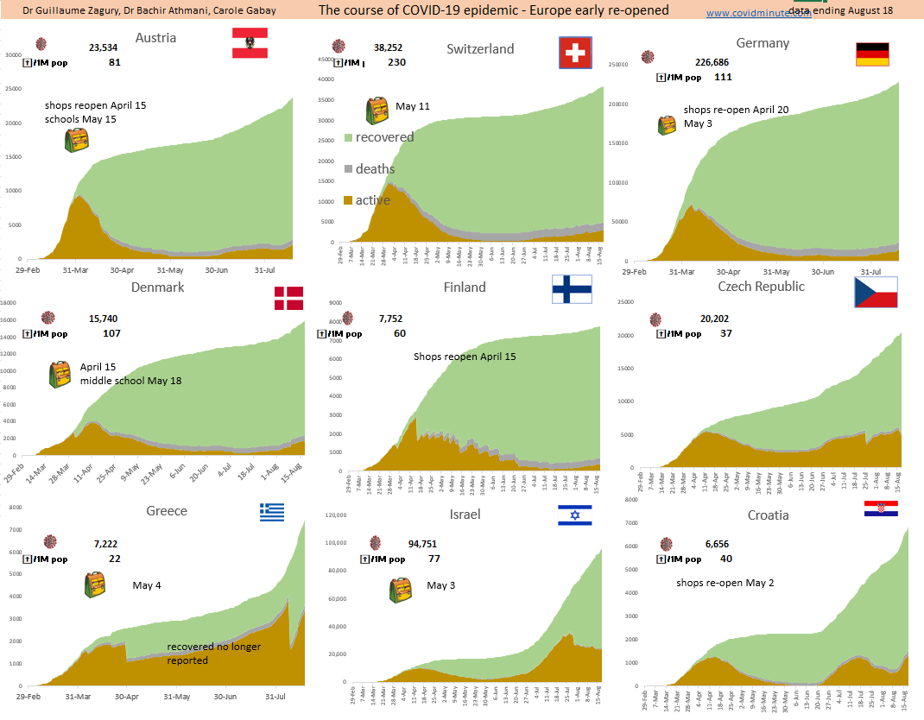
B.1/ EUROPE: A RELATIVELY POSITIVE SITUATION,…
5.1.1 BUT HAS VARIABLE GEOMETRIE: FRANCE, SPAIN, UKRAINE, A FOLLOW….

5.1.2 EVOLUTIVE TREND IN SOME NEIGHBOURS: GRAPHIC VISION
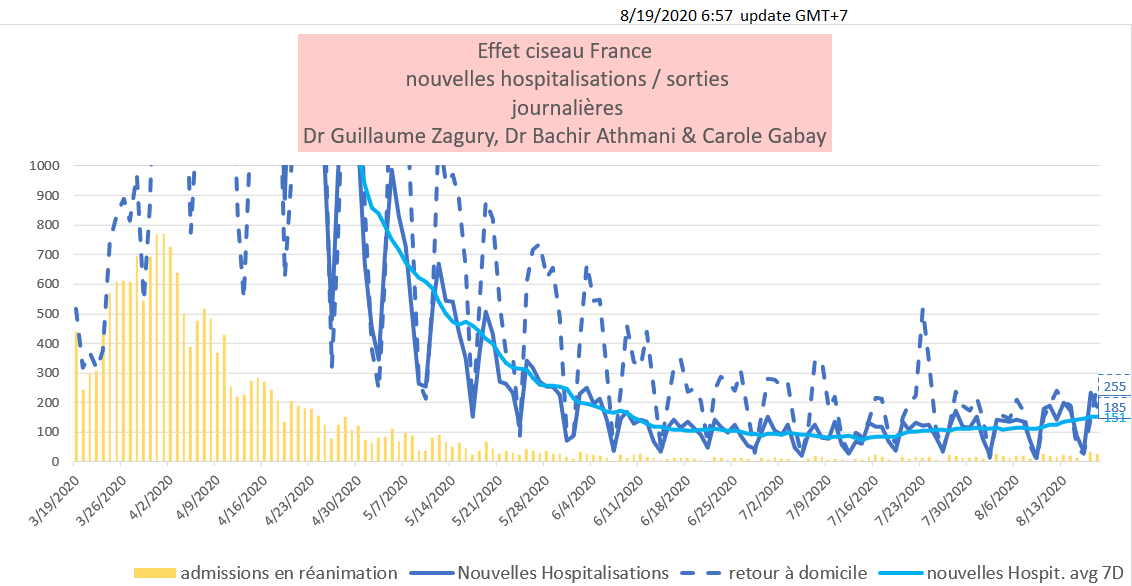
5.2 FRANCE: “LIVING WITH” BUT IN INDIVIDUAL RESPONSIBILITY (“FIRE CAN RESUME »)
5.2.1 NOTE WITH APRIL SITUATION: NOTHING TO SEE (for example: no tests at the time to evaluate the general population, only the Hospitalises were …. )
As in economics, there are many indicators (Hospitalizations, ICU boxes, Deces, test positivitis rates, Incidence C, R0 index, SOS C-,… calls), which most often come together to degagate a trend. No indicator is perfect, and each one measures part of the problem. I particularly recommend, the first 4 that reflect an indisputable medical reality “field” and the speed of circulation of the virus.
Nevertheless, knowing that we can make the numbers say many things, when they are not relativized in time, and in space: so a simple curve C-recente, can give an impression of epidemical rebound “alarmist”, while the Hospitals record almost no new patients!
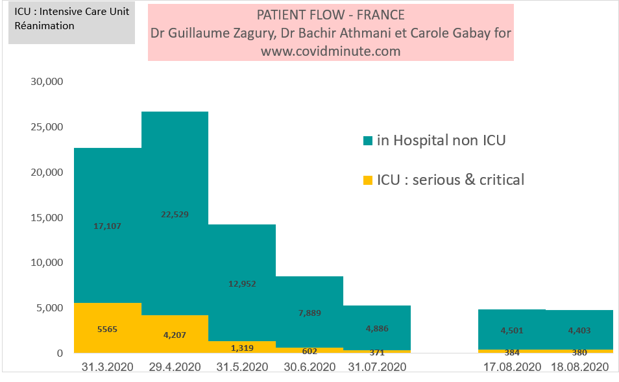
– Hospitalizations C- (with ICU): 4925 (roughly 6 times less C/April)
– ICU: 384
– Death:
Understand, that all data “dependent test” are to be interpreted with precautions (cf increase of testing – about 100k/jr- aimed at diagnosis, both in young asymptomatic, suspicions of C- yet priority, see international travelers), as shown in the following figure:
5.2.2 BUT NO NAIEVETE: DO NOT LET THE “EMBERS” BECOME “FIRE” AND MAINTAIN INDIVIDUAL VIGILANCE (“3M”) BECAUSE:
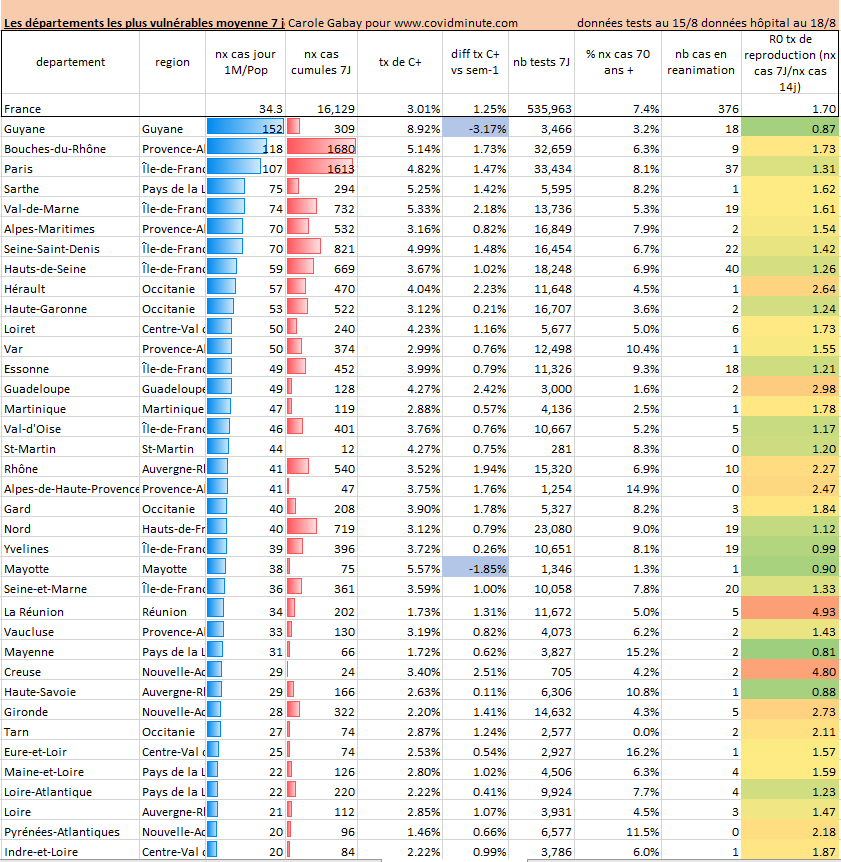
– The virus circulates (currently around 3000C/day) has different speeds depending on the region: more than 700 “Clusters” and 3 regions to follow: IDF, PACA, Guyanne,…
– Our “Barometre Region” (Carole Gabay’s analytical innovation) allows a vision according to your location:
– The appearance of autumn (possible rebound, classic respiratory viroses, …) risks making things extremely difficult (diagnosis, logistics of laboratories, ….) in case of another major episode, and as a result, prevention is required. However, while waiting for a possible vaccine (see below), prevention means education . . .
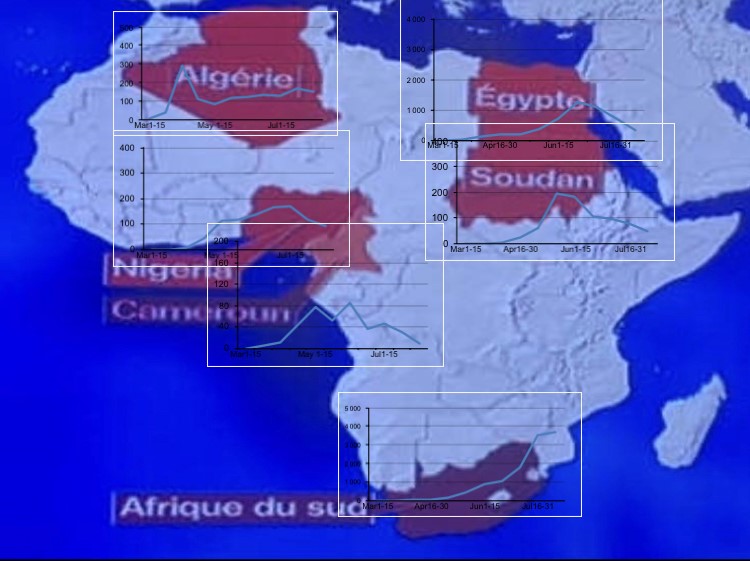
C/ ZOOM “AFRICA” (young population): 17% of the world’s population but 1% of the mortality
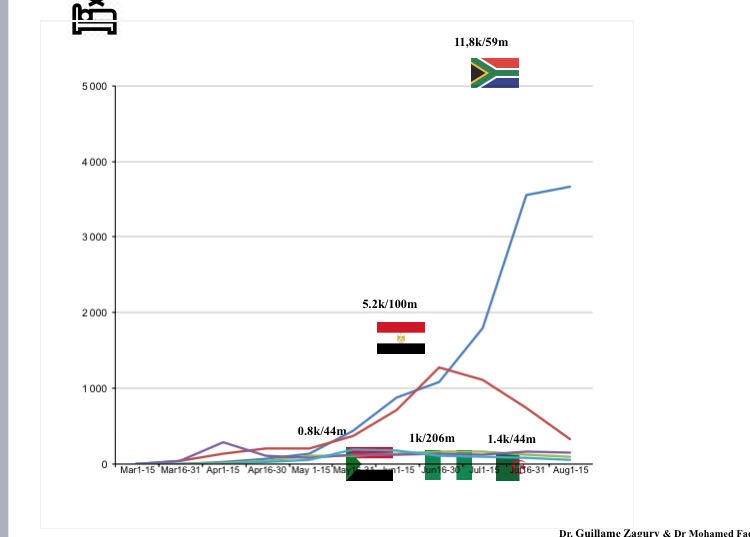
C.1- 5 COUNTRY CONCENTRENT 70% CAS: South Africa, Nigeria, Algeria, Egypt, Sudan.
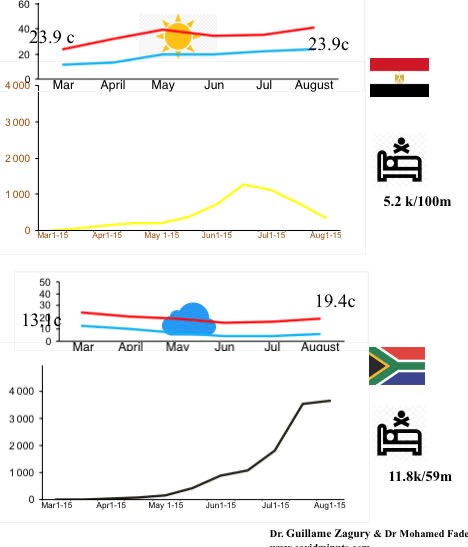
C.2 SOUTH AFRICA IN 1 ERE LINE (11k deces for 60M in epidemic phase- cf France 20k deces for 65M): REANIMATIONS ARE PLEINES A JOHANNESBURG! ….SOON THE SUMMER
– South African emergency workers (with their Israeli colleagues) are reputed to be among the “best in the world” (see environmental recruitment effect), and are currently on the ground.
C.3 AFRICA and C: MultiFACTORIEL BUT AGE A MAJOR POIDS
– Let’s cite the classic causes: Age (article made with Dr. Athmani 3 months ago), weakness of chronic degenerative pathologies decompensable by C, BCG vaccinations (cell immunitis) or immunity crossed with other viruses, genetic element (?), physical environment (see below)…
– The “temperature-humidity” hypothesis is still in debate, and the South African government is also considering a decrease in the death rate in September, with the start of the hot season:
D/ VACCIN: ALL VACCINS LEAD TO Man (more) !
D.1 Many immunologists are fairly confident about the outcome of these vaccines.
Different vaccine strategies are being tested (more than 6 candidates in Phase 3 since July and about 150 lance projects), primarily aimed at humoral immunity (antibody production), with different vectors (inactive viruses, recombinants, RNA, DNA,….).
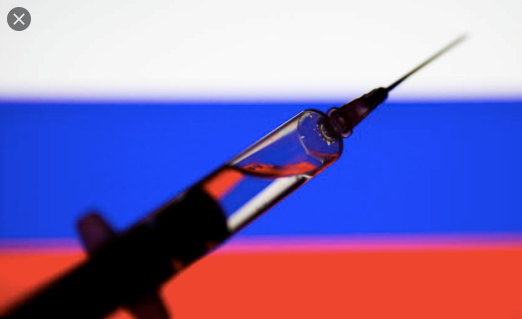
D.2 Russian Vaccine: The October Revolution?
– The vaccine developed by the Gamaleya Institute in Moscow is the first whose industrial production has begun, and the first deliveries will be available at the end of August (Interfax agency).
– Are we heading towards a strategy of type: “1243” , putting national prestige before health security? In other words, “I market first,… and I’m evaluating after,” it’s a question that some scientists take.
D.3 Historically (see case of the Ebola vaccine: a pathology whose lethalitis was assessed at -50%), between the first Phase 3 trials and the vaccination of health professionals, it took about 4 months. By analogy, if the first results are at the appointment, we could perhaps consider a first wave of vaccinations from the beginning of November …
D.4 The Chinese of Sinopharm have just announced the likely commercialization of a vaccine for mid-December, with 2 injections and a price of less than $150
D.5 If successful: who will prioritize (benefice/risk ratio)? Health Professionals, Age People, Fragile Lands (associated pathologies), Urban, …
E / TO GO FURTHER:
All the data needed is available : www.covidminute.com, as well as the entire iconographic database and the Covidflow tool (any information by country or state www.covidminute.com).
————————————————————————–
Thank you again for your trust.
“3M” (Mask-Manual-Meter), and has next week, for this panorama World.
Dr Guillaume ZAGURY,
Medecin Practitioner,
Specialist in Public Health and Medical Innovations
Cet
In China since 2000.